One of my most vivid memories from graduate school was the day Dennis Gartman came to speak to our class. If you don’t know Mr. Gartman, he is a former trader, current market commentator, and author of the daily Gartman Letter. The reason I remember this lecture so well is because immediately following the professor’s introduction, Mr. Gartman immediately declared our degrees worthless in terms of trading success. Though this caused me a bit of student-loan-induced righteous indignation, I found the rest of his talk incredibly insightful, particularly when he shared his “Rules of Trading.” You can find Gartman’s rules online here. The list is full of pearls, particularly for discretionary technical traders guided by momentum and trend-following principles. He has two rules about market mechanics and investor behavior that I want to share with you:
In the stock market, the collective wisdom has lurched to-and-fro so far this year, from a nearly 8% gain to start the year, followed by a sharp correction including a blowup of the short-volatility trade, to a trendless path since the trough of the current selling pressure in early February. The current market environment is certainly a battleground, with drivers that are both bullish (corporate earnings growth, long-term trends, fiscal stimulus via deficit spending) and bearish (rising rates, hawkish Federal Reserve posturing, stretched long-term valuations) pulling investors in different directions.
At inflection points, many market participants and pundits turn to psychological “levels,” meaning prices that represent a change in the prevailing regime. Oftentimes, these levels are completely arbitrary or in some cases represent a simple algorithm like a trailing range or trendline. One of the more common ones is whether a market is in “correction,” meaning it has declined 10% from its high. But the all-time most popular psychological level has to be a simple 200-day moving average line. Many times, when the stock market starts to pullback from a high, you hear folks on cable market shows say things like “We’ll have to see if it can hold the 200-day moving average,” or “I really think the market will bounce off the 200-day moving average,” or even “if it breaks through the 200-day, that will be very bearish for the market and we can expect a washout.”
What is so special about comparing the average of the last 200 days of a market’s price to its current price? Nothing, really. Sure, it is a measure of momentum, but the 200-day line is not necessarily a magic market elixir compared to any other technical indicator or time horizon lookback window. Except that so many investors use it as a point of reference, which makes it valuable. This is an example of something called the Thomas theorem, a version of a self-fulfilling prophecy, which claims that perception of reality, not reality itself, influences behavior. A basic explanation of the Thomas theorem goes: if a person believes something to be true, they will act as if it is true, which makes it true at some level. A classic example are parents that think their child is rebellious and attempt to restrict them, thereby turning the child rebellious. In the case of the 200-day moving average, if enough people believe the indicator is relevant, they will themselves use it as informative or trade on it, which increases its relevance.
The consequence of this behavior is that the 200-day moving average becomes incredibly relevant for many market participants. The owner of stocks might use the indicator as a trailing stop loss in effort to get out before an ordinary pullback becomes extreme. It is, of course, a mathematical fact that a previously rising market will test its moving averages as it falls. As an example, the chart below shows the S&P 500 index and its rolling 200-day moving average during the Great Financial Crisis in 2007-2009.
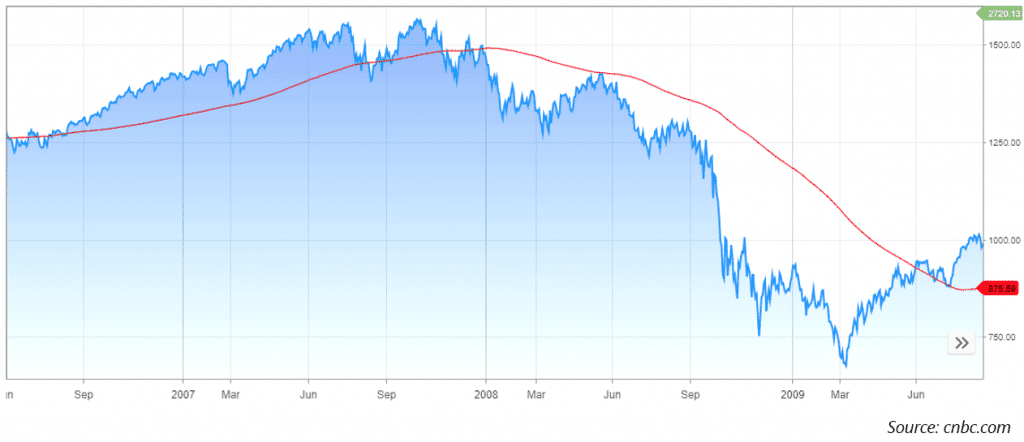
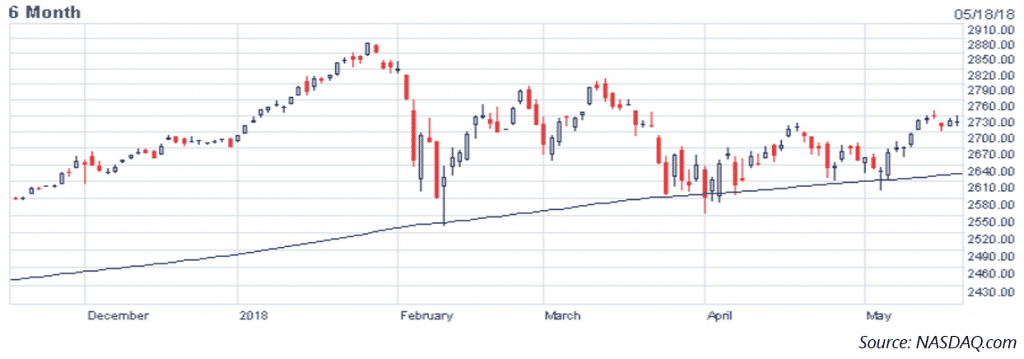
Another potential use for a moving average is for retracement buying; the person that wants to buy stocks might wait until the market pulls back to its 200-day average to buy as a form of mean reversion. This certainly appears to be happening during the recent market pullback, as the S&P 500 has bounced off its 200-day moving average multiple times over the last few months.
Though we talk about this as a representation of market psychology, it becomes a slightly more nuanced topic when you throw in the impact of algorithmic trading and more complex machine-learning trading techniques, which have exploded in popularity in recent years. Algorithmic traders following a trend-based approach might have automated buys when a market crosses above a moving average, and automatic sells when it crosses below. A reversion strategy might do the opposite in attempt to profit from a bounce around this key level. Over the last few years, machine-learning algos have “learned” that buying any market dip has been a very profitable strategy, as the S&P 500 has only suffered minor pullbacks since the 2007-2009 crisis.
As the market trends sideways, it is fair to wonder what the next key level might be for stocks. For now, it appears that the “buy the dip” camp remains in control, and the market continues to hold the important 200-day average level. It is a certainty, though, that at some point the market will either reestablish its bullish trend or finally punch through into bearish territory. With some bullish economic data and strong earnings growth, it’s certainly possible that the bull run is reestablished for the time being. Or perhaps an ultimately bearish catalyst will emerge in the form of exhaustion from dip-buyers, continued strengthening of the US Dollar, or an exogenous shock that invalidates an otherwise arbitrary technical level. Either way, in a trendless market that is showing signs of consolidating, investors should be vigilant and on the lookout for a change in direction. As Mr. Gartman says in his rules, “Trade like a mercenary guerrilla. We must fight on the winning side and be willing to change sides readily when one side has gained the upper hand.”
The two month sell-off in domestic stock markets paused in April. US Large Cap Stocks, as measured by the S&P 500, posted a modest 0.4% gain for the month after losing 6.1% in February and March. Though the S&P 500 stabilized somewhat in April, the index closed the month still down nearly 7.4% from its late-January peak. In April, the market saw a strong start to Q1 earnings season and multiple bullish economic reports including retail sales growth as well as continued expansion in the manufacturing sector. The Russell 2000 small cap index outperformed large cap stocks for the second straight month with a 0.9% gain in April. At the sector level, energy stocks led the market higher with a 9.4% return for the month, driven primarily by sharply rising oil prices. The Consumer Staples sector was the laggard for the month at -4.3%, as these stocks are sensitive to rising rates and a bullish US Dollar. Developed international markets outperformed US markets with the MSCI EAFE returning 2.6% for the month. Emerging markets, however, struggled with an appreciating US Dollar and posted a -0.3% return in April.
Stocks trended higher throughout the month, as the S&P 500 was up 2.65% through April 18th before giving back some of its gains through the end of the month. Despite a strong start to earnings season and relatively bullish economic data, markets continue to wrestle with sharply rising interest rates, additional rate hikes by the Federal Reserve, a rising US Dollar, and potential geopolitical drag from a trade war with China and uncertainty in North Korea. Market volatility, as measured by the CBOE Volatility Index (VIX), declined sharply, closing the month down to 15.93 from 19.97 the previous month. Notably, since peaking at over 37.3 in early February, the VIX has cratered over 57% as markets have stabilized. That said, the current reading remains near long-term historical averages for implied volatility.
After a modest gain in March, domestic bond indices retraced in April with the headline Bloomberg Barclays US Aggregate Bond Index returning -0.7% for the month. The US Treasury curve continued to flatten as yields at the short-end of the Treasury curve rose more than long-duration Treasury bond yields. The 2-year Treasury bond rose 21 bps to 2.47%, the 10-year bond yield rose 19 bps to 2.93%, and the 30-year bond yield rose 12 bps to 3.09%. The 10-year Treasury yield, which peaked at 3.03% in late April, has now more than doubled off its all-time low of 1.36% in 2014. The Treasury curve is now flatter than at any other time in the last 10 years. After the 2-year to 10-year spread flirted with 0.50% in January, it finally broke through in April to close the month at 0.46%. The pronounced rise in interest rates and the flattening yield curve has not been accompanied by a significant expansion in credit spreads; investors remain bullish on credit markets and economic data remains relatively positive. High yield credit spreads, as measured by the BofA Merrill Lynch US High Yield Option-Adjusted Spread, declined by 26 bps in April to close the month at 3.46%, only 23 bps off its January low.
The S&P GSCI Total Return index rose 5% in April, as bullish oil markets and inflationary concerns offset a rising US Dollar. WTI Crude Oil rose by over 5.6% for the month, closing at $68.57/bbl. after closing March at $64.91. The oil market saw a rise in April on speculation that the United States would leave the Joint Comprehensive Plan of Action (JPCOA), also known as the Iranian nuclear deal, which would result in additional sanctions against Iran. A new sanctions regime against Iran led by the US could restrict Iranian oil exports, which reached a record 2.617 million barrels/day in April. At the same time, OPEC continues to cut its oil output in effort to stabilize prices. The GSCI Aluminum sub-index gained 13.9% for the month, spiking after the US announced sanctions against Rusal, though the administration softened its stance later in the month. Despite fears of inflation and rising metals prices, appreciation of the US Dollar weighed on Gold, which declined by $13.50/oz. to close the month at $1,316.10/oz.
The US Dollar Index, which measures the US Dollar’s value against a basket of 6 foreign currencies, rose steadily throughout the month, closing 1.9% higher. The USD was particularly strong against the Swiss Franc [+3.3%], Yen [+2.8%], and Mexican Peso [+2.8%]. The US Dollar was pushed higher by rising interest rates and a hawkish Fed, which is expected to hike rates for the second time in 2018 in June and is likely to raise interest rates a total of 4 times this year.
Thank you to everyone for your feedback. Please feel free to reach out at any time with questions or comments.
Sincerely,
Arthur Grizzle & Charles Culver
Managing Partners
Martello Investments