Volatility: Equity market volatility, or the absence of it, continues to dominate headlines, with the VIX hovering below 10 for extended periods and low realized volatility. In recent months, many market pundits forecasted an uptick in volatility, and that even a small increase will cause a wipeout for investors in the “short-vol” trade. In this commentary, we examine the state of the volatility market, particularly short-vol exchange-traded-products. While we highlight the increased fragility of the VIX and prevalence of vol-based strategies as definite risks, we show how short-volatility may be useful as an equity replacement strategy when sized appropriately as part of a whole-portfolio approach.
December Market Recap: The S&P 500 posted a 1.1% gain in December, capping off the first year of positive returns in each of the 12 calendar months. The index has now posted gains in 9 consecutive years. Bullish news from OPEC benefitted crude oil and energy stocks, while disruptive weather and rising interest rates dragged utility stocks lower. Fixed income indices posted modest gains, as credit spreads were flat, and the yield curve flattened. Congress’ deal on comprehensive tax reform, which is expected to add to the deficit, was bullish for gold and bearish for the US Dollar.
In early January, the snow-pocalypse came to Virginia Beach. While stuck inside as the city was blanketed in 6 inches of snow (blizzard conditions that shut down transportation for many days and left our office’s water pipes frozen), I found myself perusing the free documentaries available on YouTube. I love documentaries, but as any frequent YouTube user knows, the recommendation algorithms are sometimes bizarre. A few clicks later, I found myself watching a 1960 made-for-TV version of Shakespeare’s The Tempest. I’m sure the majority of you at least read the play in high school English class. For those that need a quick refresher (SPOILER ALERT!), The Tempest is about a marooned magician/duke that conjures a storm to shipwreck his enemies, who had previously exiled him to a deserted island, in an effort to exact revenge and reclaim his rightful place in the kingdom. The story is about vengeance, power, forgiveness, and ultimately, redemption. I won’t bore you with the rest, but I found it oddly poetic to watch the play in the midst of the worst snowstorm I had ever encountered. Some of you northerners may be laughing at that, but remember that I am originally from Florida.
As we reflect on 2017 in the markets, the major theme of the year was not a storm but an eerie calm, demonstrated by the continued strength of global equities and the near complete absence of volatility. Notably, this is the first year ever characterized by positive S&P 500 returns in each calendar month as well as the first time the equity volatility index, VIX, broke down through the 9-handle, though the index never closed below 9 until early 2018. There are many factors driving the health of the market — the election of a business-friendly US president, earnings growth, investor confidence, etc. — but we must take note of the unusual resilience nevertheless. For example, the S&P 500 Index’s worst pullback for the year was a meager 2.8%, the second lowest since 1928.
Many market pundits see a tempest brewing, with an inevitable uptick in equity market volatility at the proverbial eye of the storm. Recent months have seen the VIX and VIX-related products widely covered in various news outlets. These reports focus particularly on the historically low level of volatility, the large and increasing net short position of non-commercial futures traders, and the impressive performance of inverse VIX-linked ETPs in recent periods of low volatility. These factors and more lead many to believe that a volatility-induced wipeout is around the corner. In this analysis, we highlight some areas of the volatility market that concern us as well as other areas that we think are being overblown. Though the volatility complex is large and includes multiple instruments and strategy types, we will focus on ETPs that are tied directly to VIX futures.
Let me state emphatically that this note is not an attempt for us to “talk our book”, as we are agnostic to the direction of volatility. Though some of our strategies trade VIX-linked ETPs (VXX, XIV, ZIV), the strategies can go long or short volatility depending on market conditions. While this is certainly not to be taken as an investment recommendation, we would only say that if one were to participate in the volatility market, he or she do so with only a small portion of his or her portfolio, as an alternative or equity-replacement strategy, and with frequent rebalancing. In addition to some of our own commentaries, this analysis draws from Valentine Ventures’ white paper entitled Is Short Volatility A “Crowded Trade?” I would encourage you to read it if you are interested in the volatility space.
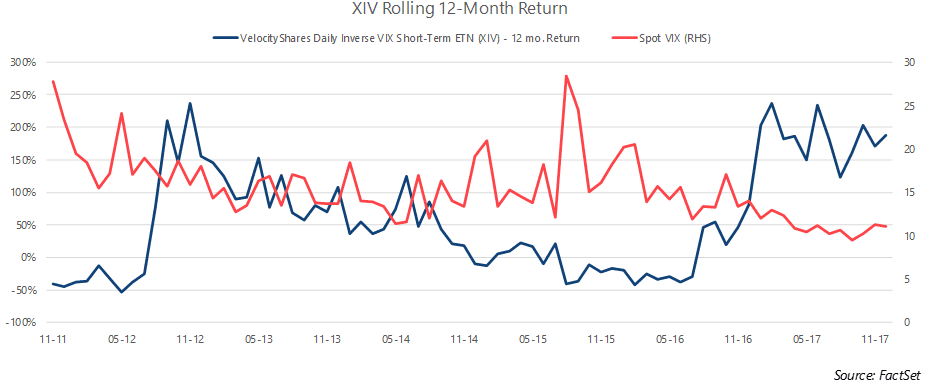
Just because the short-vol trade is getting more attention does not mean, on its face, that its recent returns are abnormal. In 2017, VelocityShares Daily Inverse VIX Short-Term ETN (XIV), which tracks short VIX futures positions at the front of the curve, returned approximately 187%. Looking at a rolling 12-month return since the ETN’s inception in 2011 shows that, while extremely volatile, prolonged periods of high returns have happened previously – with no immediate corresponding crash.
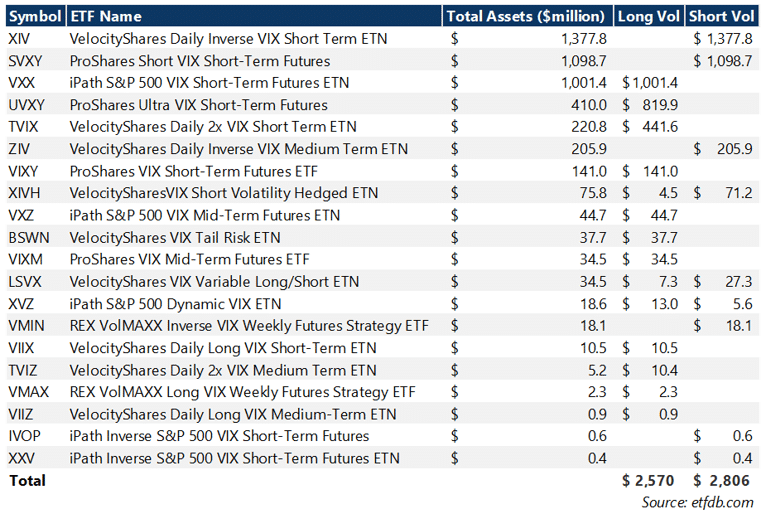
Let’s touch on the underlying drivers of VIX futures and VIX-linked exchange-traded products (ETPs). The VIX Index is derived from the implied volatility of S&P 500 index options. The VIX index itself is not tradable and is not replicable in real life due to the prohibitively expensive cost of trading the numerous options that would be required to construct the VIX’s return stream. The major way to use the VIX index to hedge or otherwise express an opinion is using futures on the VIX index or options. VIX futures are based on investor expectations about the future value of spot VIX, not the S&P 500. In addition, a few investment companies have released exchange traded products that track indexes of VIX futures. There are a number of VIX-based ETPs – both long and short – and the total combined asset value of the VIX ETP group is almost $5.25 billion as of November 2017. It is important to note that of the total assets under management in the VIX-based ETP space, it is approximately evenly split between long and short exposure when accounting for the underlying leverage in several funds.
The next chart has been making the rounds on investment websites. The point this chart attempts to make is that non-commercial traders (which includes institutional investors and hedge funds) are short volatility through VIX futures in historic proportions. The presumption is that these non-commercial traders are creating a short squeeze that when unwound will be the undoing of investors in short VIX ETPs.
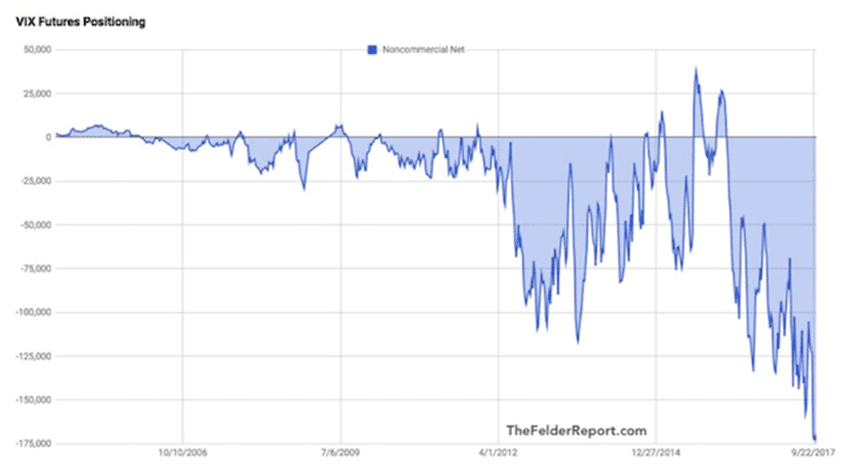
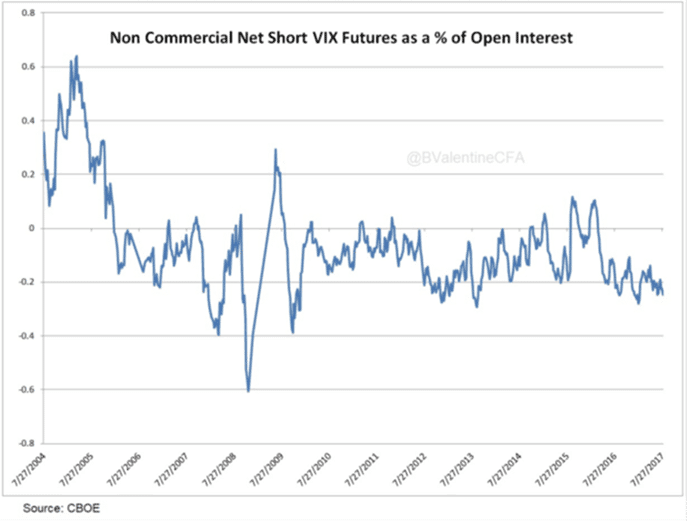
It is true that there is more non-commercial short exposure than ever before, but this graph fails to account for the explosion of the volatility asset class (both long and short) since VIX futures were introduced in 2004. Valentine’s paper charts the non-commercial VIX futures position as a percentage of total open interest. With proper scaling, the “huge” net short position looks relatively normal.
Similarly, if there was abnormally high selling pressure in VIX futures, we would expect to see suppression of premium along the curve, leading to a flatter curve. On the contrary, the % premium available along the curve is high by historical standards. This may be a VIX-specific phenomenon; other volatility markets and strategies are less liquid and more difficult to access, making the VIX complex the preferred method of hedging for many investors, and therefore leading to more volatility buying concentrated in this index’s derivatives.
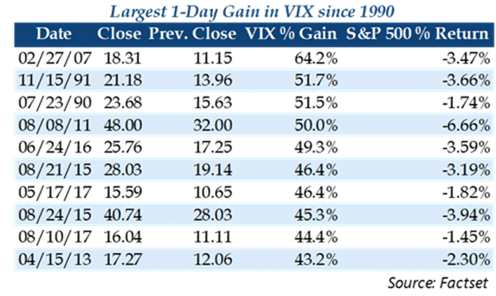
To be clear, we are merely claiming that the volatility market appears to be functioning normally given current market conditions; the term structure (futures curve slope) is within normal bands, the ETP market remains balanced between long-vol exposure (likely for hedging long equity exposure or short-term speculation on a downturn) and short-vol exposure, and the large net short position for non-commercial traders is at least partially muted when set to a proper scale. We are not claiming that the short-vol trade will be profitable or that short-vol products are safe for most investors. In fact, we acknowledge that the volatility market has shown increasing fragility to moves in the S&P 500, which generally happens in low volatility environments. This may or may not be a temporary phenomenon; increases in VIX-sensitivity in previous low-volatility regimes have subsided before as volatility normalizes (sometimes accompanied by significant market losses, sometimes not). In any event, it does present increased risk to short-vol ETP investors, but whether that risk rises to calamitous levels is not as clear. The August 10, 2017 VIX spike (44.4%) was the 9th largest on record. Equally significant is the equity market’s relatively benign return for the day (-1.45%) compared to returns in similarly large VIX spikes. The average daily return for the S&P 500 during the other VIX spikes in the chart below was -3.37%. The low level of spot VIX may create a scenario where smaller equity market moves create larger moves in spot VIX, causing magnified moves in VIX-linked ETPs. However, the August 10th spike in VIX caused XIV to lose 13.5% for the day, and a continuation of the selloff caused a loss of 4.6% on August 11th. A significant move, yes, but not a wipeout event for most investors, particularly in diversified portfolios.
In addition, we have discussed in other commentaries the reflexive nature of low equity volatility, meaning that falling volatility is a positive feedback loop that begets even lower volatility. Strategies that use volatility as a portfolio weighting mechanism — some examples include risk-parity, trend-based strategies, and VAR-focused approaches — continue to add to positions as volatility falls, further lowering volatility. This reflexive nature of volatility increases shock risk, particularly with the amount of leverage in the system, because rising volatility forces selling to decrease risk, which potentially begets even higher volatility, causing more selling, and so on. The violent move in VIX in August 2015 gives us a look at the magnitude of losses over a brief period in short-vol ETPs caused by a huge move in spot VIX. Over a 5-day period in August 2015, spot VIX increased by more than 200% from 13 to over 40, though it hit an intraday high of over 53 on August 24th. This caused the short-vol ETP group to post significant losses; XIV lost 54% in a 2-week timeframe and continued to lose value into early 2016, where peak losses hit over 66%. A massive loss, but a bearable one for investors with appropriately sized positions in a diversified portfolio with reasonable rebalancing, particularly considering the gains in XIV before that event and since.
The role of short-volatility strategies as a portion of a total portfolio must be properly framed. We think about short-vol exposure as equity-replacement; as the VIX is based primarily on the price of S&P put options, short-VIX exposure is inherently equity-sensitive. From 2011-2017, XIV’s beta to the S&P was over 4.5. This means that you can potentially use a 1% position in XIV to replicate a 4.5% equity position. Using this logic, a small portion of XIV in the equity portion of a portfolio (5% or so) can impact the total portfolio similarly to a 22.5% position in a stock index. Using short-vol as an equity-replacement strategy, then, would allow investors to free up additional capital and invest more defensively, putting less capital at risk and potentially limiting total portfolio risk and drawdown, while keeping the same return potential as a higher equity portfolio. For example, an investor could replicate a 60% equity position with 5% XIV (assuming 4.5 Beta), and 37.5% S&P 500, freeing up an additional 17.5% of capital to invest more defensively. We can test this theory to the inception of VIX futures in 2004 using VIX ETP Extension Data from SixFigureInvesting.com*. Below we present the results of a simple simulation using two portfolios, both rebalanced monthly:
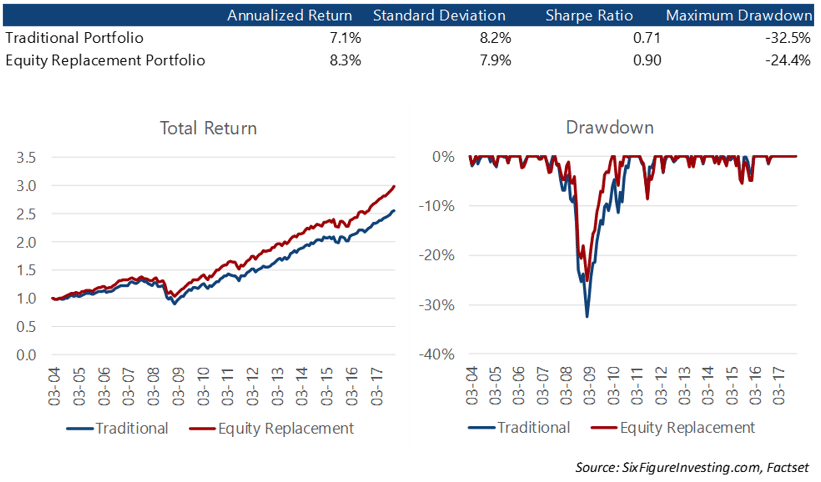
As you can see from the simulation above, the inclusion of a short-VIX position as an equity-replacement strategy can increase returns, while reducing portfolio volatility and drawdown. The equity meltdown of 2007-2009 provides an interesting case-study in the benefits of equity-replacement strategies; despite the massive drawdowns in stocks and short-VIX positions (SixFigureInvesting.com data estimates XIV would have lost over 90% in the downturn), the equity replacement portfolio simulation posted better returns (by losing less) than the traditional portfolio. This is due to the increased bond position afforded by the equity replacement portfolio.
We do agree with the bears on one crucial point: it is a question of when, not if, short-VIX products will incur another large drawdown. This means that investors that choose to enter the short-vol trade through inverse VIX-linked ETPs should be prepared for significant bouts of interim volatility, including potentially large drawdowns on those positions. For those already interested in the space, we would advocate sizing exposure prudently (possibly incorporating short-vol exposure as part of an equity replacement strategy) and utilizing a rules-based, risk-managed approach that can participate in the large upside returns available in the short-vol trade, while potentially limiting drawdown.
Most domestic stock indices capped off a strong year with gains in December, as Congress boosted investor confidence by passing a tax reform bill. US Large Cap stocks, as measured by the S&P 500 Index, gained 1.1% for the month to bring year-to-date returns to 21.8%. The annual gain for the S&P 500 marks the best return since 2013 and the 9th consecutive positive year, which is the longest streak since 1928. Small cap stocks, measured by the Russell 2000 index, posted a modest 0.4% loss for the month to close the year up 14.6%. The MSCI EAFE Index, an index of international developed stocks, gained 1.6%; international stocks outperformed US indices in 2017, with EAFE returning 25.6% for the year. Emerging Markets lead headline indices for the year with a 37.8% gain after a 3.6% return in December.
At the sector level, Energy led the market higher with a 4.9% gain in December, though the sector lagged for the year with a -1.0% return. Energy stocks were boosted by supply disruptions and OPEC’s December meeting, during which the cartel agreed to extend their production limit agreement through the end of 2018. The story for the year, though, was Technology stocks, which posted a 38.8% return in 2017 despite a flat December. Utilities were the laggard for the month, returning -6.1%, as many regions experienced colder than expected weather, wildfires impacted west coast operators, and short-term treasury rates rose. Market volatility, as measured by the CBOE Market Volatility Index (VIX), trended lower through the first half of the month, bottoming at 9.34 on December 11th. The VIX ultimately touched 8.9 intra-day on the December 20th, the first time the VIX broke through the 9-handle. The index ultimately drifted higher to close the month at 11.04, 2.13% lower than November’s 11.28 close.
Headline Fixed Income market indices delivered gains in December to cap off modest 2017 returns. The Bloomberg Barclays US Aggregate Bond index returned 0.5% for the month to bring year-to-date returns to 3.5%. The US Treasury curve flattened significantly in December, driven by rising short-term rates, and falling 30-year treasury yields. In December, the 2-year Treasury rose 10 bps to 1.88%, the 10-year Treasury fell 1 bp to 2.74%, and the 30-year Treasury fell 9 bps to 2.83%. The 2/10 spread closed the year at 0.86%, 0.72% lower than 1.24% spread at the end of 2016. High yield credit spreads, as measured by the BofA Merrill Lynch US High Yield Option-Adjusted Spread, rose 2 bps to close the month at 3.63%. Despite rising in each of the last two months, high-yield spreads finished the year 59 bps lower, after closing 2016 at 4.22%.
The S&P GSCI Total Return Index gained 4.4% in December, bringing 2017 returns to 5.8%. The Index was led by Energy and Industrial Metals sub-indices, which returned 5.9% and 8.0% for the month, respectively. Energy was boosted by the previously mentioned OPEC deal and supply disruptions; West Texas Intermediate (WTI) Crude Oil trended higher for the second straight month, closing December at $60.40/bbl. after closing November at $57.42/bbl. Crude gained $6.51/bbl. in 2017, a gain of over 12%, and WTI’s December close was its highest monthly close since November 2014. Still, crude remains well below its post-2009 high of approximately $114/bbl. The tax reform package, which is expected to add meaningfully to the deficit, sent Precious Metals higher, with gold gaining 2.7% for the month. Gold had a particularly strong year, after closing 2016 at $1,152/oz., gold rallied throughout the year, and ultimately closed at $1,305/oz., a gain of over 13%.
The US Dollar Index, which measures the US Dollar’s value against a basket of 6 foreign currencies, returned -0.99%. The Index posted losses in 9 of the 12 months this year, returning -9.9% on a year-to-date basis, its worst year since 2003. The losses in December came despite an additional rate hike from the Federal Reserve and Fed guidance to three more rate hikes next year. Much of the USD weakness is explained by loose fiscal policy, as President Trump’s administration pursues deficit expansion, and the strength of the Euro, which rallied 12.4% against the Dollar for the year.
We’re thankful for your continued interest and feedback. As we reflect on 2017, it was certainly a year of firsts for us: we launched Martello in April, took on our first clients in May, and most importantly, Charlie and his wife Sheridan welcomed their first child into the world in November. There is much to be thankful for, and we wish you all health, success, and prosperity in the year ahead!
Sincerely,
Arthur Grizzle & Charles Culver
Managing Partners
Martello Investments