As this historically prolonged bull market enters its 10th year, the swiftness of the small correction experienced in early February provided investors with a rare gut check. In the days following the S&P 500’s 4% loss on February 5th, many market pundits pointed to “market structure” as a driver of the increased volatility. Though these concerns were largely centered around the XIV and other exotic exchange-traded products, it is useful to evaluate larger market imbalances that can increase risk. Though we have discussed the buildup of short-volatility and short-correlation bets across market strategies as examples in previous posts, the increasing implicit bet on momentum caused by the index-based investing revolution must also be addressed.
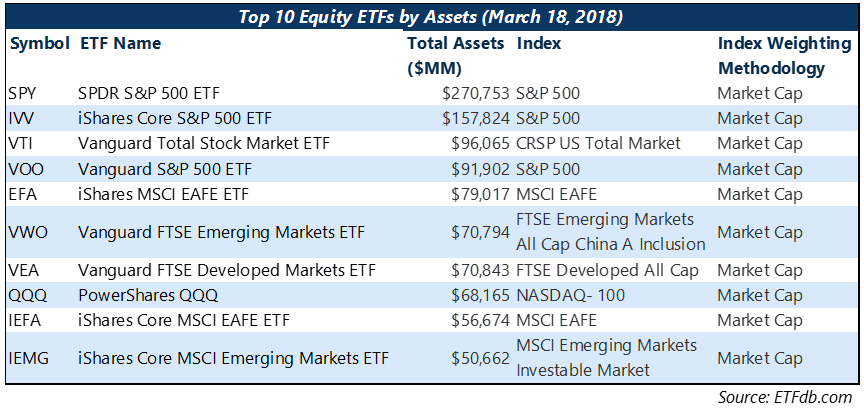
The impact of passive investing on market structure has been a pervasive topic in the active management newsletter circuit for years. The theory goes: as assets flow into passively-managed products and actively managed assets decline, price discovery becomes more difficult and the market is more susceptible to shock. To be clear, we are not in this camp and are not interested in bashing the concept of index-based investing. In fact, we disagree with the entire premise of the active/passive debate, as we believe that “passive investing” does not actually exist. Each investment made is an active decision, and every index has underlying mechanics, assumptions, and various factor exposures. The potential problem comes when all the largest and most liquid ETFs (top 10 table below), representing over $1 trillion in assets, have the same weighting methodology and are therefore exposed to similar risks, and three out of the top four (representing over $520 billion in assets) have the exact same underlying index.
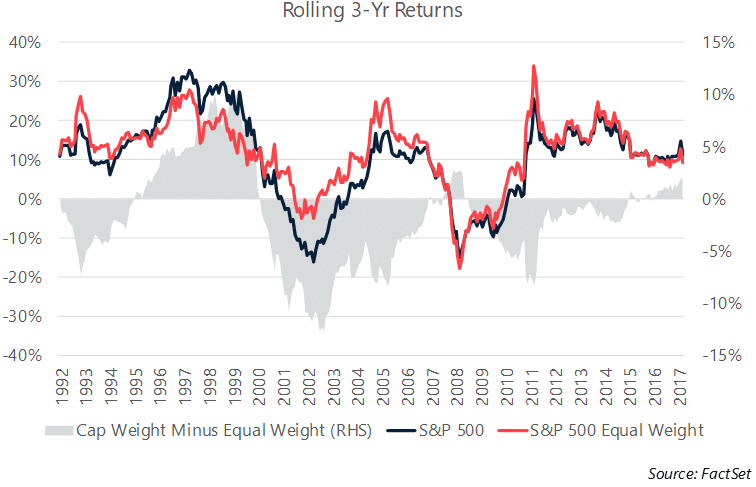
The way an index provider chooses to weight the underlying holdings of an index is an important component of the index’s strategy, even if only indirectly. An equal-weighted index, for example, is an implicit bet on mean-reversion and value. During rebalancing, the index will pare its winners and add to its losers. Market-cap weighting is, on the other hand, a bet on momentum; stocks that outperform get increased weight in the index and stocks that underperform see their weights shrink. So, in market regimes characterized by momentum, we would expect market-cap weighting to outperform while we would expect equal-weighting to outperform in value-focused market environments. You can see from the chart below that this relationship has generally held in the recent past; the market-cap weighted S&P 500 outperformed its equal-weighted counterpart during the euphoric market of the dot-com 1990s, in the runup to the great financial crisis, and in the recovery since 2011. Admittedly, part of the outperformance in recent years is surely due to the massive inflows into the ETF space, which is dominated by market-cap weighted product.
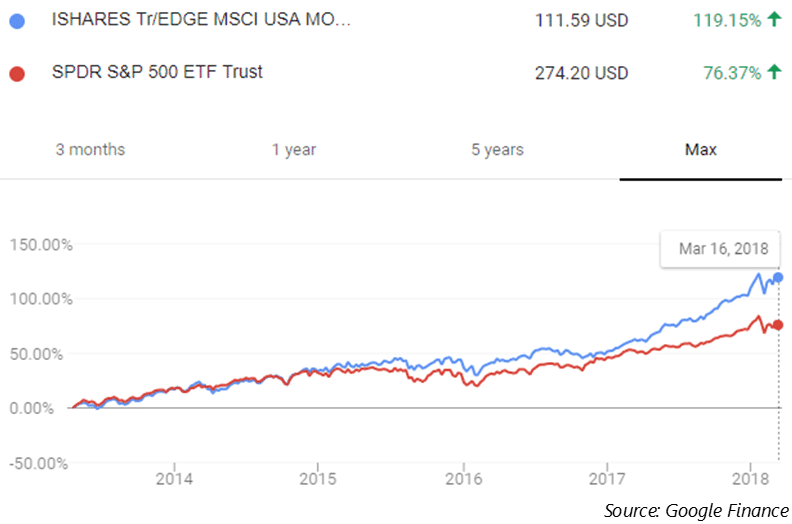
It makes sense that most index providers would choose a momentum tilt in their weighting methodologies; there has been a bevy of research over the last several decades highlighting the persistence of the momentum factor in delivering excess return, including a 215 year backtest published by Christopher Geczy and Mikhail Samonov in 2014 (link). From our experience performing due diligence on other investment managers, we also know that straight-momentum or quasi-momentum-based optimization strategies are growing in popularity in both the active equity and ETF strategist industries. Even the robo-advisors (which to the best of our knowledge use simplistic mean-variance optimization algorithms to set their portfolios) have a short-volatility, short-correlation, long momentum bias. These algorithms need assumptions for expected return, volatility, and correlation, and using historical returns as an expectation moving forward embeds this asset class momentum factor risk. This is a similar construct to the short-volatility feedback loop we've discussed in previous commentaries. Momentum-based strategies buy assets that have gone up the most, sending those assets even higher, leading to more buying. The same works in reverse; when markets turn, momentum-based strategies sell, leading to weaker returns, leading to more selling, etc. The current market environment is increasingly tilting toward using momentum-biased indices, which are then utilized by strategists and portfolio managers using momentum-based trading strategies — it’s a world of momentum squared. In such a market, you can imagine that using momentum as a selection criterion for stocks would generate further outperformance; the iShares MSCI USA Momentum ETF (MTUM) has outperformed the SPDR S&P 500 ETF (SPY) by over 42% since its launch in May 2013.
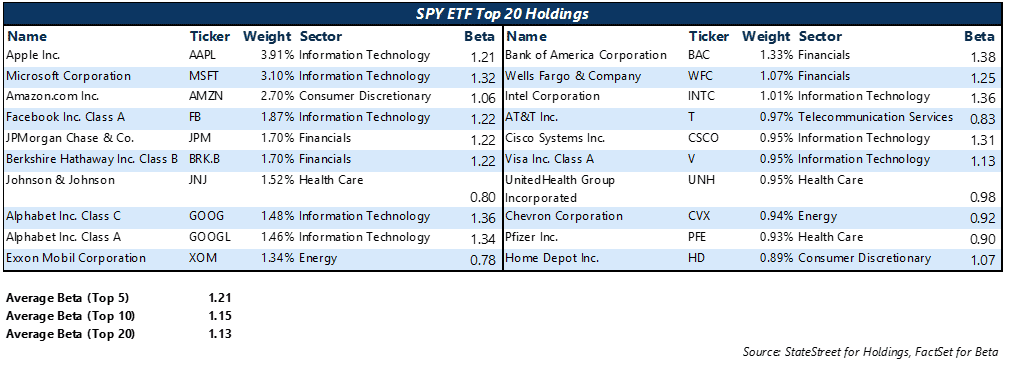
Momentum, like any other strategy, is not bulletproof. Though the long-term returns of the momentum factor have been excellent and well-researched, the concept of momentum crashes stands out as a notable risk. An insightful but lengthy paper on the topic of momentum crashes can be found here (link). Conceptually, a momentum crash is a market regime categorized by significant and swift mean-reversion. For equity strategies, the momentum crash is closely linked to the concept of market beta, and usually takes place around a market correction. It goes like this: during a strong bull market, high beta stocks generally outperform, leading to the categorization of high beta stocks as “momentum.” When the market turns, however, high beta stocks generally underperform the market in general, leading to an underperformance of the high momentum portfolio. After a crash, the momentum portfolio is reconstituted to include the best performers which are the stocks that went down the least in a downturn: typically, low-beta stocks. During a market rebound, these low-beta stocks generally underperform due to strong mean-reversion of the previously crushed high-beta stocks, leading to further underperformance of the momentum portfolio. Given the near decade-long bull market in stocks, you would expect to see a high-beta tilt in the largest names of the market cap portfolio.
This doesn’t necessarily mean that a momentum crash is around the corner. As we’ve discussed in previous posts, an overextended market generally needs a catalyst to re-rate lower in a meaningful way. However, with the market increasingly tilting toward an implicit momentum bias, it is prudent for investors, particularly those in the ETF space, to evaluate their portfolios for these hidden factor risks.
-A.G.
The S&P 500 finally broke its historic streak of 15 consecutive positive months with a -3.7% return in February. After an overextended run in the first weeks of January, rapidly rising interest rates and inflation fears caused the index to struggle badly in the opening days of the month. The selloff was highlighted by a more than 4% daily decline on February 5th, the worst day for the index since August 2011, which was accompanied by an over 115% daily spike in the CBOE Volatility Index, easily the largest on record. After falling over 8.5% in the first 6 trading days of the month, though, the market got some relief and rallied nearly 5% into the end of the month. Selling pressure was not limited to large cap stocks, as the Russell 2000 small-cap index fell by 3.9% for the month, and the S&P 400 Mid Cap index returned -4.4%. International indices underperformed, with the MSCI EAFE index returning -4.5% and the MSCI Emerging Markets index returning -4.6%. At the sector level, only the Information Technology sub-index posted a gain for the month, albeit modest at 0.1%. Financials also outperformed with a -2.8% return, as rising interest rates are generally seen as favorable for the banking sector. Despite inflation fears spooking investors, the Energy sub-index struggled to a -10.8% monthly return. Consumer Staples was similarly weak, posting -7.8% for the month, as these companies’ margins should suffer in an environment of upside inflation surprise.
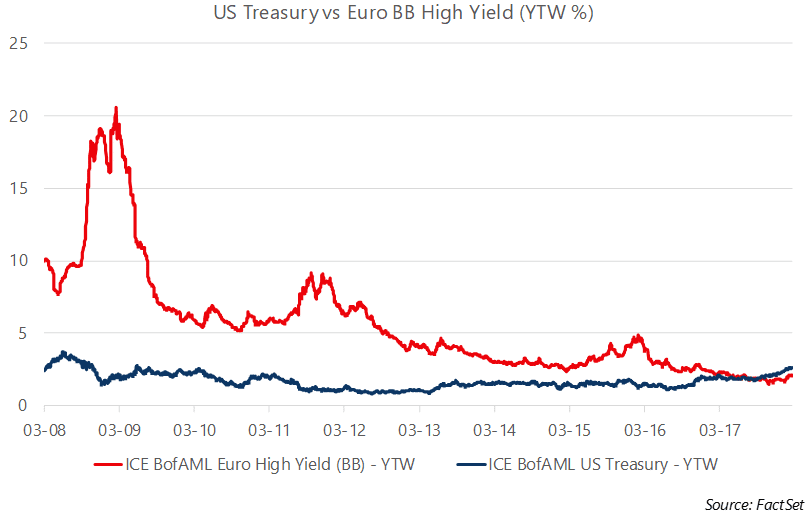
The bond market struggled with rising rates, and the headline Bloomberg Barclays US Aggregate Bond index returned 0.9% for the month. US Treasury rates continued to rise, as the 2-year Treasury rose 11 bps to 2.25%, the 10-year Treasury rose 15 bps to 2.87%, and the 30-year Treasury rose 19 bps to 3.13%. Interest rates have risen considerably in the last 12 months, particularly at the front end of the curve, as evidenced by the 2-year Treasury’s nearly 1% move from the 1.26% level at the end of February 2017. Meanwhile, high yield credit spreads, as measured by the BofA Merrill Lynch US High Yield Option-Adjusted Spread, remain near historically-tight levels, closing the month at 3.47%. European high yield is similarly low-yielding, and in fact BB-rated high yield in Europe now trades at lower yields than the BofA Merrill Lynch US Treasury index. This froth in credit also extends to the private market, as several recent reports show that lending standards have laxed as too much supply chases too few deals; in the US, about half of leveraged loans are now lite on covenants, while covenant-lite loans make up about 60% of issuance in Europe.
The S&P GSCI Total Return index returned -3.3% in February, with only a 4.7% gain in the Agricultural sub-index showing signs of inflation fears in the commodity market. The Agricultural sub-index was led by gains in the Cocoa [+9.6%], Wheat [+6.8%], and Cotton [+6.0%] indices. In addition to general inflation fears, Cocoa was boosted by a dry weather spell in West Africa, and Cotton benefitted from reports of strong demand. Gold and Oil, both generally harbingers of inflation, both fell with equities in the first week of February, lending credence to the theory that the move was a general deleveraging. Gold opened the month at $1,348/oz. and closed as low as 1,309/oz. before rebounding modestly to close the month at $1,319.40/oz. Similarly, WTI Crude Oil opened the month at $64.77/bbl. before trading down to $58.07/bbl. on February 9th, and ultimately rebounding to close February at $61.55/bbl.
The US Dollar Index, which measures the US Dollar’s value against a basket of 6 foreign currencies, posted a modest gain on the month despite an uptick in inflation fears. The dollar appreciated against most major currencies with the notable exception of the Japanese yen, which rallied as the Bank of Japan decreased the monetary base and cut the size of its bond purchases.
We’re thankful for your continued interest. As always, please reach out any time with your questions and feedback.
Sincerely,
Arthur Grizzle & Charles Culver
Managing Partners
Martello Investments