This began as a desire to make a delicious stew; a few months ago, I was treated to a wonderful oxtail stew at a Haitian restaurant in Key West and I was determined to try to make it myself. Surprisingly, to me at least, it is very difficult to find oxtail in my area. I started at my neighborhood supermarket, to no avail. Several stops later, I was ultimately able to find a few pounds at a high-end grocery store several miles away, albeit for the price of a decent steak.
I was perplexed by the lack of availability and price of this traditionally “cheap” cut of meat; historically, oxtail and other tough, gelatinous meats were significantly discounted relative to more desirable cuts. In the embarrassingly long research that followed, I learned some interesting things about the market forces at work, the influence of celebrity chefs on the increasing popularity of certain meat cuts, and the impact of commoditization on US grocery store chains. Globalization, too, plays an important role: it turns out that so-called “variety meat” (organs, oxtails, tongue, cheeks, etc.) are more valuable to international consumers, and therefore the majority of those products are shipped overseas at premium prices, leading US consumers to import those prices and pay more domestically. These market forces not only apply to the cheap meats, but also to bones. Not bone-in steaks, just bones. Animal bones, previously considered a throwaway, now fetch decent prices, primarily due to the bone broth fad (thanks, hipsters). While I’m sure that my grandfather, who was a butcher and grocer, would be shocked to see these developments, these trends can teach us a lot about the concept of value and how it is impacted by various market participants, trends, and fads over time.
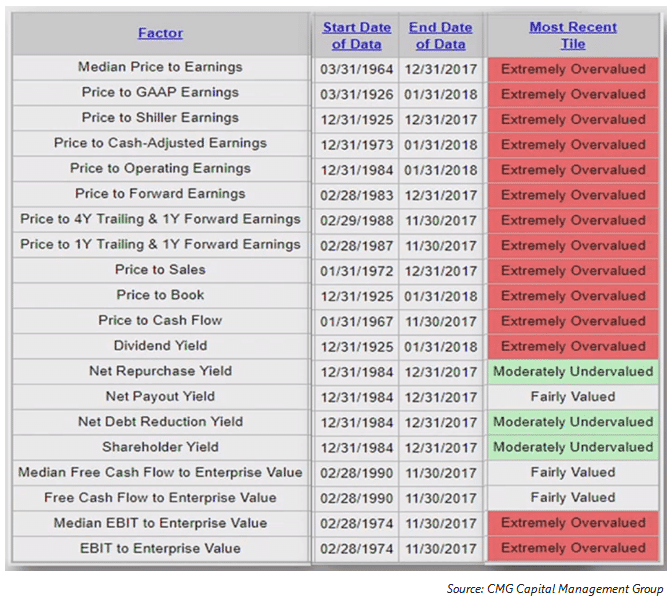
The rising price of a meatless bone is an oddly poetic metaphor for our current market environment, where investors have endured years of squeezing more from less – accepting more risk across asset classes to meet their hurdles in an environment of low expected returns. The US equity market remains the standout and is extremely overvalued compared to its own history by almost every metric shown in the table below. We have also touched on the historically high popularity of stocks in previous posts, as evidenced by the near-record equity ownership as a percentage of assets for US households and record margin debt.
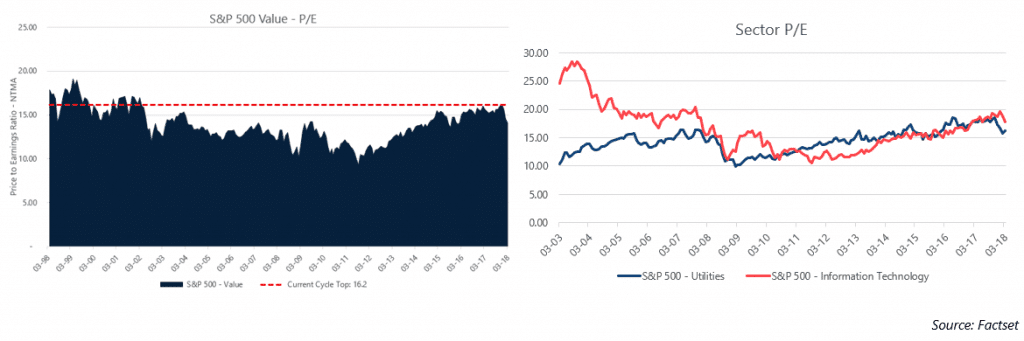
Even the market’s “cheap meats,” value stocks, have seen significant reduction in their value over the last several years. Prior to the recent downturn in February and March, the S&P 500 Value Index was trading at a P/E level not seen since the early 2000s, far above the peak prior to the Great Financial Crisis of 2007-2009. Perhaps the most glaring example of “less value in value” are utilities, the archetypal value sector, which have traded at a P/E above or in-line with the high-flying technology sector for many years despite a considerable growth lag. This valuation anomaly is clearly a function of suppressed global interest rates causing yield-starved investors to reach for income. The relative underperformance of utilities as rates have risen over the last year may be evidence that this trend is ready to normalize.
Though much airtime is devoted to stock market valuations, the lack of value seen in current markets is not limited to the stock market, as core fixed income and higher-risk credit offer less value to investors than nearly any other time in history. We have touched on the increasing and asymmetric risk in bonds for several months, most specifically in our October 2017 (link) and January 2018 (link) monthly posts. In an April 2017 study, Guggenheim measured the “value” available in fixed income by looking at a ratio of Yield per Unit of Duration. This simple ratio reflects how well investors are compensated for taking interest rate risk; if the Yield per Unit of Duration is high, investors are well compensated for taking interest rate risk, while low values mean investors are poorly compensated for taking such risk. By that metric, value in US core fixed income and US high yield are near their lowest levels ever.
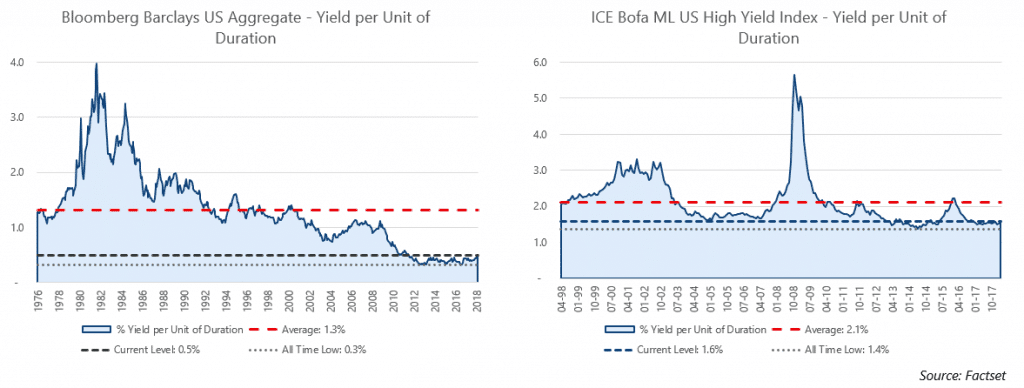
Another way to think about this is to consider how much of an interest rate move it would take to wipe out an entire year of income. With AGG’s effective duration of 5.88 years and a yield of 2.81%, it would take only a 48 bps upward shift in interest rates to erase the gains from yield for an entire year. High yield, which is typically lower duration and offers higher rates, would require a greater move in interest rates to offset gains from income, though high yield obviously comes with additional credit risk. Global high yield is not immune to this value suppression trend; just last month we shared a chart showing BB-rated high yield in Europe trading at lower yields than the BofA Merrill Lynch US Treasury index. Instead of re-posting it, we’ll just add a link (here). Investors should consider whether the current yields are an acceptable margin of safety given the risks of a continuance of rising rates or, in the case of high yield, a significant default cycle.
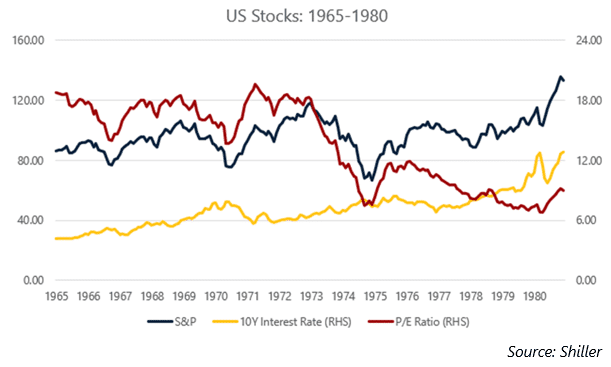
It’s clear that value available across traditional asset classes has eroded significantly in the period since the Great Financial Crisis. Over the last year, we’ve discussed many reasons for this high-valuation paradigm including years of accommodative policy by the Fed, ZIRP/NIRP from global central banks, and low interest rates from traditional income sources pushing investors into riskier assets, including stocks, to generate their requisite income stream. However, with the Fed and other central banks pumping the brakes on stimulus in fear of inflation, recent months have shown the potential for a reemergent focus on value in the market. The relative-value argument for stocks—the notion that stocks deserve a higher than usual multiple given the current yields on offer in the bond market—has been challenged by rising rates. In fact, US short-term interest rates have risen considerably to the point where income-motivated investors have real choices for their capital for the first time in over a decade. For example, the one-year US T-bill now yields more than the S&P 500 for the first time since December 2007. In response to rising rates (among other factors), P/E ratios in the equity market have ticked down slightly, though current ratios remain far from levels considered “cheap” or even normal by historical standards. The equity market multiple would likely need to rerate much lower if rates rise significantly from here, particularly if longer-term rates get the same upward momentum thus far only seen at the front of the curve. During the last prolonged rise in interest rates from the mid-1960s through the early 1980s, the equity market experienced several large drawdowns and the P/E multiple collapsed from levels near 20 to the mid-single digits, leading to a lost decade of near-zero returns for stocks.
We reiterate that our view of risk is a mosaic, but our current readings show elevated risk across equity and credit markets. We view the value of cash and cash-like instruments as reasonable at this juncture; after the recent interest rate moves, investors can get reasonable rates at the short-end of the curve without taking significant duration risk, with the option-value of dry powder on hand to deploy at more attractive levels in equity and credit markets.
-A.G.
March saw a continuation of the increased equity market volatility that finally reemerged in February. US Large Cap Stocks, as measured by the S&P 500, declined by 2.5% to close the first quarter down 76 bps. After underperforming large caps in February, the Russell 2000 small-cap index posted a modest gain in March, marking the first monthly gain for the Russell 2000 in a down S&P 500 month since June 2015. International indices also delivered negative returns, with the MSCI EAFE index returning -1.9% and the MSCI Emerging Markets index returning -2.0%. At the sector level, Technology stocks, which have led the market rally, fell 3.9% for the month as several high-profile stories about Facebook’s data scandal, fears about self-driving car safety, and President Trump targeting Amazon weighed on the sector. Financials also delivered weak performance with a -4.3% return as the yield curve flattened and fears about a trade war fears surfaced.
Stocks traded higher for the first two weeks of the month, and the S&P was up 2.8% month-to-date through March 9 before falling sharply to close the month 2.5% lower. The primary driver for investor fear is the prospect of a trade war between the US and China, as the global superpowers hit each other with significant tariff packages in March. Market volatility, as measured by the CBOE Volatility Index (VIX) had fallen to an intra-month low of 14.64 on March 9th before closing the month over 36% higher at 19.97. Implied volatility of technology stocks spiked even more as President Trump took aim at Amazon and Facebook was hammered by the Cambridge Analytica scandal; the CBOE Nasdaq Volatility Index (VXN) spiked over 54% off its intra-month low of 17.3 to close March at 26.68.
The bond market posted modest positive returns, with the headline Bloomberg Barclays US Aggregate Bond Index gaining 0.6% to close the first quarter up 1.2%. The US Treasury yield curve flattened significantly during the month, with yields at the short-end of the curve rising and long-duration bond yields falling. The 3-month T-bill rose 7 bps for the month to close March with a 1.72% yield. To put the steepness of the rise in short-term rates in context, the 10-year Treasury bond traded at a 1.72% yield as recently as October 2016, at which time the 3-month T-bill yielded approximately 0.25%-0.35%. The long-end of the curve fell significantly in March, as fears of a trade war caused a flight to quality assets; for the month, the US 10-year fell 13 bps to close March at 2.74%, while the 30-year fell 15 bps to close the month at 2.97%. Meanwhile, high yield credit spreads, as measured by the BofA Merrill Lynch US High Yield Option-Adjusted Spread, rose 25 bps to close the month at 3.72%, the highest monthly close for the index since August 2017.
The S&P GSCI Total Return index returned 2.2% in March though underlying commodity markets were mixed. The Energy sub-index led the market with a 6% gain for the month, driven by a strong rally in crude oil. WTI Crude Oil rallied over $3/bbl. to close March at $64.91/bbl., as the possibility of continued OPEC supply controls boosted prices. In addition, the US and Europe are set to review additional sanctions against Iran as a consequence of Iran’s missile testing and involvement in Syria. GSCI sub-indices for refined products also showed gains, with Gasoil [+6.9%], Heating Oil [+6.1%], and Gasoline [+4.4%] each posting positive returns.
The US Dollar Index, which measures the US Dollar’s value against a basket of 6 foreign currencies, wavered throughout the month before closing slightly lower. Trade war fears also weighed on the Dollar, particularly as the US and China exchanged tariff threats. Despite the trade war fears, the Mexican Peso rallied 3.4% against the USD in March, as representatives in NAFTA talks signaled considerable progress toward a deal.
Time flies. At the end of April, we reach the one-year mark since Martello’s launch and our flagship strategy will hit 12 months of live returns. We are very thankful to have all of you on this journey with us and we appreciate your continued interest and feedback. As always, please reach out any time.
Sincerely,
Arthur Grizzle & Charles Culver
Managing Partners
Martello Investments