Walking the Tightrope: The Federal Reserve continues its path of further interest rate increases, as several officials have cited an expectation of rising core inflation. For the last 20 years, investors have been able to rely on bond positions as a significant counterbalance to stock holdings, but periods of high/rising inflation and higher yields generally lead to less diversification benefit from bonds. Though we do expect rates to remain lower for longer due to macroeconomic and demographic forces, we identify the asymmetric risks developing in core fixed income funds and high yield bond markets in Europe and the United States as potential problem areas.
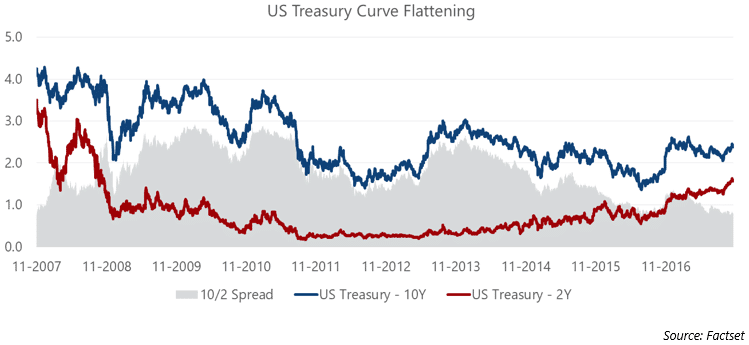
October Market Recap: The S&P 500 continued to rally with a solid gain in October, led by better than expected earnings from several technology bellwethers. Continued hawkishness from the Federal Reserve caused further flattening in the US Treasury yield curve, with the 10/2 spread approaching 10-year lows. Commodities were led higher by gains across the energy complex, particularly gasoline, which saw declining inventories and worries about short-term supply due to Hurricane Nate. The US Dollar appreciated against most major currencies, and the Euro weakened following unexpected dovishness from ECB President Mario Draghi.
Throughout October, much airtime was given to the 30th anniversary of Black Monday; on October 19, 1987, the Dow dropped nearly 22%, resulting in the worst single-day market performance in modern financial history. Several financial writers have focused on the potential similarities between the current market environment and the market in 1987, leading many to believe a similar crash is imminent. Pundits use the structural selling pressure caused by the “portfolio insurance” craze in the 1980s as a template for the next liquidity-induced crisis, which they claim will be caused by herds of passive investors, trend-followers, and short-volatility strategies simultaneously heading for the exit. For several months, we have discussed the dangers to portfolio construction presented by persistently low volatility and herd behavior. Though the prospect of pounding the table on an overvalued, complacent equity market is tempting, we also attempt to not say the same things month after month. So, in the interest of keeping our readers awake, we focus on a markedly different anniversary and draw a parallel to the current market environment.
By October 1802, Ludwig van Beethoven was becoming increasingly deaf. In the depths of his suicidal despair, he penned a letter intended for his brothers. The letter, known as the Heiligenstadt Testament, outlines his depression and embarrassment over his hearing loss. The letter is worth a read, if for no other reason than to get inside the mind of one of the most famous musicians the world has ever known. In his Testament, Beethoven identifies that as a master composer, the one thing he had taken for granted above all else, his ability to hear, was now slipping from his grasp:
…Ah how could I possibly admit such an infirmity in the one sense which should have been more perfect in me than in others, a sense which I once possessed in highest perfection, a perfection such as few surely in my profession enjoy or have enjoyed…
We all know how the story ends; ultimately, Beethoven pulled himself from despair and in fact persevered, composing many masterpieces (including 7 symphonies) after the Heiligenstadt Testament. His 9th symphony, arguably his most famous work, came over 20 years later. By which time he was nearly completely deaf.
An interesting component of the human condition is our unique ability to take for granted such important things; be it running water, food, our families, or, in Beethoven’s case, the ability of the musician to hear. Financial market participants are not immune to this behavior. At Martello, we spend a lot of time thinking about which assumptions the financial community takes for granted and how those are likely to change over time. For example, in May we discussed the assumptions underpinning portfolio risk metrics like Value-at-Risk (VAR) and how those cause potential problems when the volatility landscape changes. That mindset has also meant focusing significant energy on the role of bonds in a portfolio. For over 20 years, the financial advisory community has been able to rely on bonds as a reliable hedge to equity markets while interest rates have fallen steadily since the early 1980s. So, for what amounts to the entirety of most advisors’ careers (including our own), bonds have been the Holy Grail of investments: an equity market hedge with positive carry. However, recent months have seen the Fed note signs of rising core inflation and a healthy economic environment, leading to its acceleration off the zero bound. Several ancillary signs appear to indicate fixed income risk is rising and investors should proceed with caution.
Though investors have enjoyed a mostly reliable negative stock-bond correlation for the better part of two decades, the long-term correlation between the two asset classes is volatile and regime-dependent. As the chart below shows, there have been several periods in history with strong positive correlations between equities and bonds.
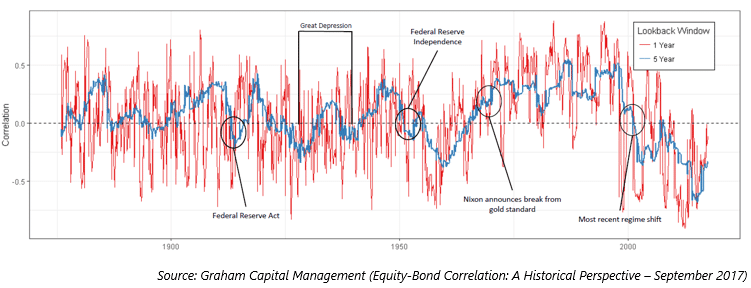
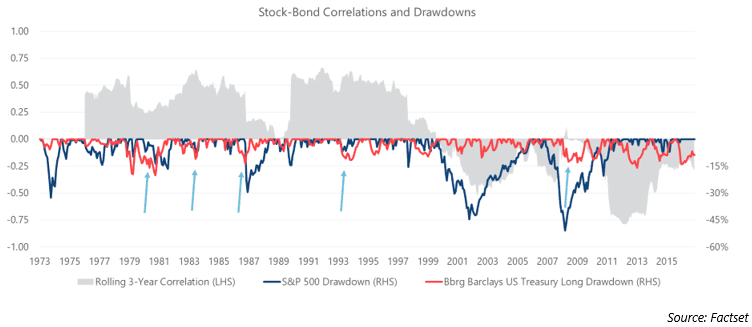
Though this is tautological, it bears repeating—in market regimes characterized by negative stock-bond correlation, bonds are a hedge in an equity market drawdown. In market regimes with positive stock-bond correlation, bonds do not provide as much of a diversification benefit. These periods of positive stock-bond correlation are generally categorized by high or rising inflation and real yields. Rising yields impact both stock and bond prices negatively as equity valuations rely on a discount factor which is tied to the risk-free rate. And as we all know, the Fed is committed to raising rates. Whether or not they will be able to fully follow through is yet to be seen, but it would be a mistake to ignore that fact considering this correlation data. How much does this positive correlation affect fixed income returns? As you can see from the chart below, past positive correlation regimes led to more frequent drawdowns for both stocks and bonds at the same time.
Meanwhile, core fixed income investors are faced with the unenviable proposition of taking greater interest rate risk for less yield. A recent Guggenheim study shows an interesting metric called Yield per Unit of Duration, shown in the next graph, which measures “value” available in a fixed income index. If the Yield per Unit of Duration is high, investors are well compensated for taking interest rate risk, while low values mean the opposite – investors are poorly compensated for taking interest rate risk.

Several factors have caused this value to fall over time, including the general downward trajectory of interest rates and the massive increase in Treasury debt over the last 10 years, which tilts core fixed income indices toward higher government debt allocations. This creates asymmetric risks for core fixed income investors. Let’s ask ourselves what happens to fixed income portfolios during periods of rising rates. Assuming the investor is positioned in a mix that matches the Bloomberg Barclays US Aggregate or is invested in the ETF AGG, we can use the current level of the graph above to determine that the capital losses incurred in a 42 basis point parallel upward shift in interest rates would erase any income gains generated from yield.
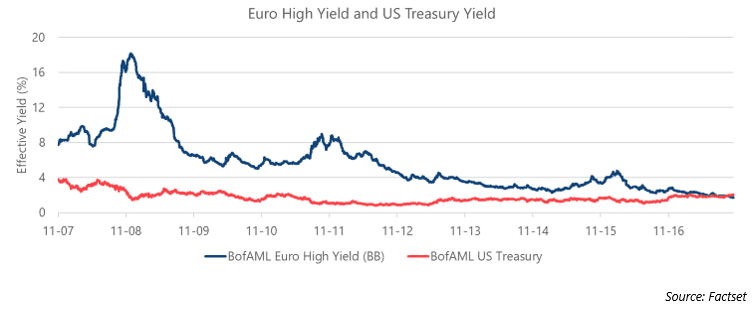
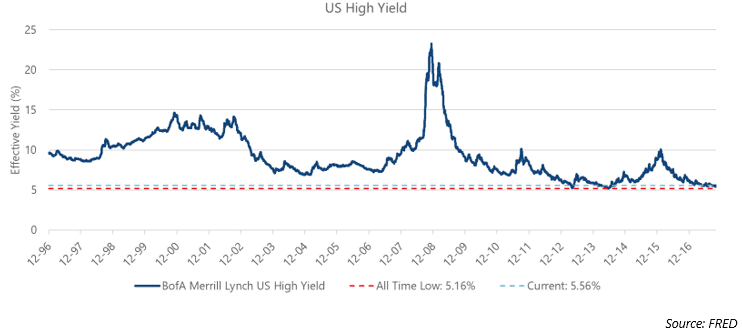
Similarly, junk bond markets currently offer maddeningly low yields, so much so that it is difficult to refer to them by the politically correct “high yield” moniker. In particular, Europe has reached levels that can only be described as silly. In our August market review, we briefly discussed the yield available in BB-rated European “high yield” bonds as it neared the yield on offer from US Treasuries. Since that time, investors have pushed yields lower in European credit, to the point that the Euro High Yield index trades at a lower yield than the US Treasury index.
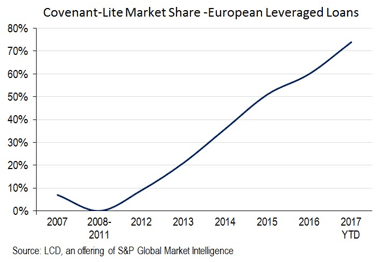
Part of this is explained by the higher duration in the US Treasury index and the negative interest rate environment in Europe. Still, we view this complacency towards credit risk as unsustainable, particularly as covenant-lite market share in the European leveraged loan market has reached alarming levels.
The US High Yield market, yielding 5.56%, looks attractive by comparison – even as the BofA Merrill Lynch US High Yield index flirts with historically low yield levels.
The overall picture for fixed income looks mixed; the flattening yield curve in the wake of Fed interest rate hikes generally signals investor caution about the future economy, while historically low high yield rates signal optimism. Also, several macroeconomic forces – the disinflationary impact of high global debt, tightening monetary policy in the US, and aging demographics in the developed world – all point to tame inflation, persistently low interest rates, and, therefore, a mostly reliable negative correlation between stocks and bonds in diversified portfolios for the near future. That doesn’t mean that bonds will be as strong of a diversifier in the next equity bear market. Indeed, the already low level of interest rates may give yields less room to fall in the next crisis, even if the Fed quickly returns to zero interest rate policy. Overall, we view bonds as having an important role in a diversified portfolio, but investors may want to consider incorporating other diversifying assets (such as gold) or alternative strategies that can help protect the portfolio in times of market uncertainty.
Domestic stock indices continued this year’s trend of positive performance as a strong start to earnings season, expectations for growth, and signals of a forthcoming tax reform plan sent equity markets higher. US Large Cap stocks, as measured by the S&P 500 Index, gained 2.3% for the month, while the Russell 2000 small-cap index returned 0.9%. The S&P 500 has now posted gains in 12 consecutive months, which is tied for the longest streak on record; since March 2016, the S&P has generated positive returned in 19 of 20 months, with a -1.82% loss in October 2016 the lone exception. The MSCI EAFE Index, an index of international developed stocks, gained 1.5%, while the MSCI Emerging Markets Index rallied 3.5% for the month to bring year-to-date gains over 32%.
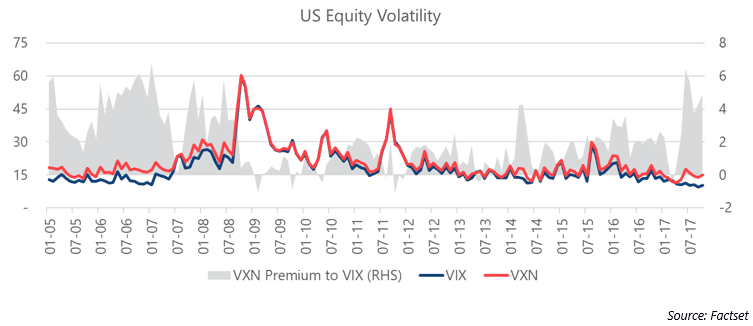
At the sector level, a host of strong earnings reports from technology bellwethers sent the S&P 500 Technology Sector Index higher by 7.8% for the month, adding to an already strong year of outperformance. Several technology companies, including Amazon, Microsoft, and Alphabet (parent company of Google) reported better than expected earnings. Despite the positive announcements, the CBOE NASDAQ Volatility Index (VXN) traded up 8.7% for the month. The VXN, which tracks the implied volatility of index options on the NASDAQ 100 Index, had traded down in recent months. As you can see from the chart below, the VXN is trading at a significant premium to the VIX, which tracks implied volatility on index options for the S&P 500. The high premium of VXN relative to VIX, to pre-financial crisis levels, signals investors are either increasingly concerned with technology positions or increasingly complacent with respect to the market at large. The VIX also trended higher throughout October, closing the month 7.05% higher at 10.18.
Fixed Income markets posted modest gains in October, as expectations for a December rate hike tempered a continued contraction in credit spreads. The US Treasury yield curve has flattened significantly in recent months, as investors push up short-term rates in anticipation of more rate hikes by the Federal Reserve. In October, the 2-year Treasury rose 12 bps to 1.59%, the 10-year Treasury rose 5 bps to 2.38%, and the 30-year Treasury rose 2 bps to 2.88%. Despite the flattening yield curve, which is generally associated with cautious investor sentiment, the high yield market continued to show strength in October. High yield credit spreads, as measured by the BofA Merrill Lynch US High Yield Option-Adjusted Spread, tightened by 5 bps to close October at 3.51%, though the first weeks of November saw spreads trend up to 3.76% by November 10th. After a significant spike in September, benchmark treasury yields in Europe fell in October, as the 10-year German treasury fell 10 bps to close the month at 0.36%, while the 10-year UK treasury bond closed October at 1.33%, 3 bps lower than its September close.
The S&P GSCI Total Return Index rallied 3.8% in October, as a continued rebound in energy and growth-sensitive metals fueled the rally. The Energy sub-index returned 4.9% for the month, led by a more than 10% gain in Gasoline. The Unleaded Gasoline index traded up throughout October, as Tropical Storm Nate caused concerns about supply and the EIA reported a significant reduction in inventories. West Texas Intermediate (WTI) Crude Oil also traded higher in October, closing the month at $54.64/bbl., $3 higher than September’s $51.64/bbl. close. Bullish global growth expectation sent the industrial metals complex higher. The GSCI Industrial Metals sub-index was led by Nickel [+17.2%] and Copper [+5.5%] in October as investors expected solid demand out of China in the wake of the country’s Communist Party congress meeting.
The US Dollar Index continued to rise with a 1.6% gain in October to close the month at 94.552. The Index, which measures the US Dollar’s value against a basket of 6 foreign currencies, continues to benefit from hawkish statements from the Federal Reserve, while recent dovish statements from the European Central Bank (ECB) provided an additional tailwind for the greenback. In October, the ECB extended its bond purchases to September 2018 and pushed any potential rate hikes to 2019 or beyond. After strengthening against the dollar for much of the year, the Mexican Peso weakened by nearly 5.1% in October, as President Trump has signaled a willingness to dismantle NAFTA in favor of bilateral trade deals with Mexico and Canada.
We’re thankful for the continued interest and feedback. As always, please feel free to contact us with questions or comments. We wish everyone a happy first half of the holiday season here in the United States.
Sincerely,
Arthur Grizzle & Charles Culver
Managing Partners
Martello Investments