It’s typically a bad word in finance. “We want more return, and less volatility,” exclaims another firm’s imaginary client. After all, who likes uncertainty, the most basic definition of the word. Volatility has become synonymous with stress, so much so that when a pundit uses the phrase “we’re seeing a rise in volatility” on TV, one understands his or her portfolio probably just lost some money. But there’s another meaning of the word “volatility” once you move past the mundane version. Volatility is itself an asset class — you can trade it, you can hedge with it, and you can profit from it. Once the word volatility becomes a tool you can use, you look at it a different way. Some tools are misused, like we all saw in February when the XIV was delisted and many investors lost a lot of money. Most that bought the XIV did not understand what it was doing and certainly did not read the prospectus, treating it like it was any other equity security rather than a trading instrument meant to give average investors short exposure to the VIX futures market, a potentially dangerous thing. XIV took a lot of blame for exposing the volatility market to individuals that did not understand it, and we heard a good deal about algorithmic investment strategies that caused the problems that occurred that day.
After the market recovered from the February blowup and rebounded to new all-time highs, volatility reemerged in late September. Increasing interest rates and continued fears of a trade war spooked investors, leading to another moderate pullback for stocks. Mild corrections like this are a normal part of healthy markets. So far, this drawdown has been relatively mundane with the S&P 500 peak-to-trough currently less than 6%. Despite this, the selloff caused another flurry of finger-pointing from television pundits, many finding that “programmatic trading” or “the computers” were reasons for the market’s decline. The question of whether computer-based algorithmic trading can actually cause a market decline is complicated, and the debate has raged on since the “portfolio insurance” debacle contributed to the Black Monday crash in October 1987. Portfolio insurance is among the most basic hedging algorithms (when the S&P goes down, sell futures), which is a fine strategy for one person to utilize, but when it becomes so popular that it itself impacts the market, it added fuel to an ordinary selloff to cause a true panic event.
Algorithmic-trading is a buzzword, but behind it is the simple reality that computer programs are constructed by humans, and a program does what it is told by its programmer. Because of that, algorithms are often filled with the same biases and logical traps that cause humans to struggle as investors. Importantly, these strategies are implemented by people that understandably lack the foresight to see that such a strategy could itself affect the market as it becomes widely popular, like portfolio insurance in the 1980s and short-vol strategies today. This mantra was repeated ad nauseam in February 2018, when risk parity shops were outright blamed by some for de-risking during a volatility event and extending a market rout past where it should have stopped.
It is difficult to determine which cohort of trading strategies counts as the type of “programmatic trading” as pointed out by many pundits over the last few weeks. The introduction of computer-driven trading has exploded in popularity over the last two decades, and ranges from simple algorithm-based investment models to highly complicated, auto-adaptive black-box machine learning techniques. Even fundamental equity strategies, where managers screen a universe of stocks for certain qualities (value, growth, etc.) and buy a basket of the most desirable stocks, could be considered computerized trading in today's world.
Our point is that, in most cases, these programs do not in and of themselves cause a market to fall. But, they can certainly impact the violence and severity of the decline depending on the situation. It’s the point that major market moves arrive not simply from algorithmic trading, but from a concentration of lots of money employing the same algorithmic trade. This is no different than if humans did the same; it’s just that computers, in their attempt to be fast and quick to act, may all, at the same time, find the same information material to their investment strategy and may be programmed to take the same action as each other within a much smaller window of time than humans would. Remember, humans used to make decisions based on meeting with members of their firm, contemplating the decision over a period of time, and then finally instructing an institution to execute their decision. All of this expands the trading window from one day to potentially many weeks. This is long enough that many could be doing the exact same thing but as a group would not have a material effect on the market because there would always be someone willing to step in to take the other side of the trade.
Granted, there are strategies that have second-order effects. This is an intuitive idea: some algorithmic trading programs adjust to changing market environments, and therefore could begin selling AFTER a market begins to show signs of deteriorating, further extending losses. Like the 1987 example above. Or any strategy that attempts to target a certain overall portfolio volatility (e.g. Risk Parity) and responds to increasing realized volatility in markets by reducing its positions. This, when combined with the explosion in popularity of those firms that target volatility, could certainly drive the market lower with greater speed than ever before.
One eerily similar characteristic of the recent market pullbacks in February and October 2018 is the positioning of the CTA-complex ahead of the downturn. As a brief recap, a CTA (Commodity Trading Advisor) is a type of hedge fund that trades futures contracts instead of stocks, bonds, ETFs, etc. Trend-following/Momentum is a primary type of strategy employed by CTAs, and one that has grown in popularity over the last two decades; indeed, CTAs delivered incredible outperformance during the Great Financial Crisis of 2007-2009, primarily by being long bonds and short stocks. Société Générale (SocGen) publishes a collection of indices related to CTAs as well as their “Trend Indicator Daily Report” (https://cib.societegenerale.com/fileadmin/indices_feeds/ti_screen/index.html) which is the bank’s Trend-Following CTA replicator at a 15% target volatility. This daily report can give market-watchers a decent sense of how the CTA complex, particularly the trend-focused segment, is positioned at any given time. In October, SocGen’s indicator report showed long positions in stocks, oil, and the U.S. dollar, while carrying short positions in bonds and gold. This is a very similar positioning to the period ahead of the February selloff, and one that is certainly understandable at some level — stock markets have steadily advanced while interest rates have risen, and these funds are structured to bet on a continuation of the trends. The issue for market structure comes, as mentioned earlier, when these strategies respond to increasing volatility by reducing exposure, potentially leading to further volatility. The synchronized reversal of nearly all on-trend positions mentioned above (long stocks, short bonds, long oil, short gold), certainly supports this idea of general deleveraging.
Strategies utilizing artificial intelligence and machine learning have also become increasingly popular over the last several years. In a nutshell, AI-based strategies use available historical data to train an algorithm, and not only process new data as it becomes available but also re-train the algorithms in an attempt to tease out new patterns in the data and build a model that’s used to make investment decisions. The program goes through millions or billions of iterations, looking for the optimal combination of factors to profit in the current market environment. Let’s be clear about one thing, many of these strategies have had tremendous success over time. We know several of the major players in the space, and there is a lot of genius behind the idea. Unlike your basic factor-based equity strategy that focuses on value stocks, every strategy in this space is significantly different, and necessarily so: the results are entirely dependent on which inputs are chosen, the cleanliness of those inputs, what metrics they use as measurements of success when training the strategy, which brand of off-the-shelf or custom software is used, which algorithms they decide to use to refine their results, and believe it or not, which random numbers the computer pops out at any given moment during training. It is impossible to truly know how these strategies contribute to market structure or how they might respond to a shifting market regime. Even many portfolio managers inside AI investment managers struggle to fully understand why the algorithms they use do what they do. This is of course the reason AI exists in the first place: to use the power of advanced computing to make sense of data that humans simply could not do on their own.
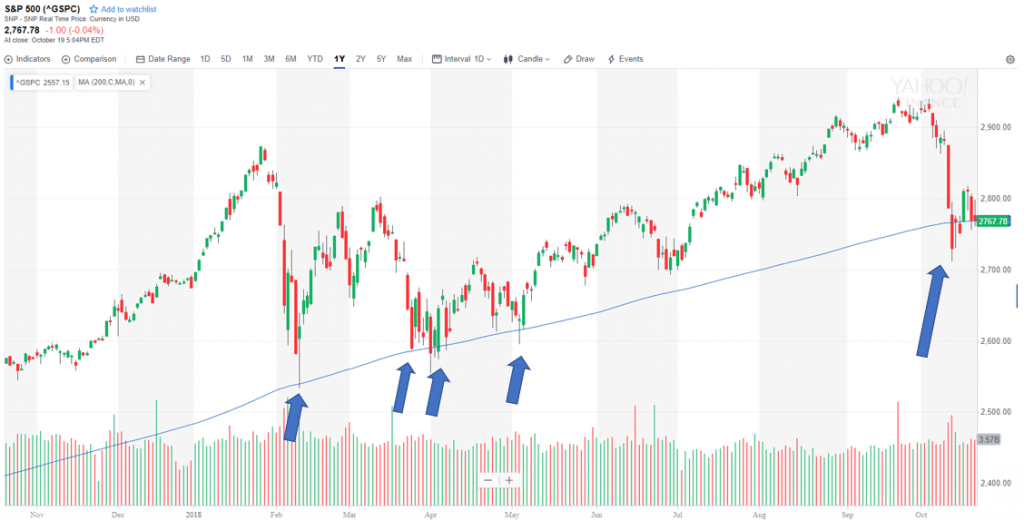
AI strategies are only as good as the data you give them. That’s why the good practitioners are religiously cleaning their input data. And the cleaning doesn’t end there. It takes a great team of people to bring in clean inputs in a timely enough manner that the strategy can process the data and act on the new information quickly. But most pay attention to the recent data and its cleanliness. The dirty secret is that for AI to work in all environments, it must be fed data from all environments – and that fully complete dataset simply doesn’t exist. AI’s use in investment markets has exploded over the last few years at a time of relative calm, an interventionist Fed, and reasonably stable correlations. The best, most complete, and cleanest data comes from the same time period. Rates have been falling for longer than firms have complete, clean datasets. As you get further back in time, you see data quality degrade, get less frequent due to lower volume or to a lower recording frequency, and you see entire markets fall off and disappear because nobody thought the data would be useful enough to save. Sure enough, there’s an entire industry making huge profits selling old data to just these types of investment firms. In such an environment, you can imagine that these strategies have learned on their own that buying a pullback in the market is a highly profitable strategy, as the S&P has bounced off its 200-day moving average multiple times in the last year without breaking through in any significant way (the outcome of the current selloff obviously remains to be seen). And, like many of the other alternative strategy types, most AI strategies use significant leverage. The very nature of these models relies on market patterns and correlation assumptions to hold to what they’ve been fed. A potential problem arises, of course, when market conditions change rapidly in an unexpected way due to a regime shift, exogenous shock, or any other factor on which it remains untrained.
Remember, we do not believe these types of strategies cause markets to decline; markets have of course experienced selloffs regularly for hundreds of years before the invention of the computer. Human traders and computer-driven approaches alike are likely to respond to negative stimuli with selling. We do, however, see the increasing popularity of these approaches as potentially speeding up the pace of market pullbacks. Put another way, we believe that the increasing concentration of highly reactive, high frequency strategies increases the overall fragility of markets, and the signs are all around us. It’s no surprise that 5 of the largest one-day VIX spikes of all-time have occurred in the last 2+ years, during a period otherwise characterized by a lack of volatility. We also showed some examples of shocks in the fixed income market back in our May 2018 piece.
Despite the recent pullback, larger macroeconomic indicators don’t seem to be pricing trouble on the horizon. High yield credit spreads have been particularly resilient. This means that market participants still view economic conditions as bullish and that the recent selloff is a temporary phenomenon and not likely to cascade into an extreme scenario. We have not yet seen an inversion of the yield curve, which if inverted would indicate that a recession is statistically very likely to hit. Still, the hidden risks to market structure caused by the prevalence of these approaches should cause investors to consider how they structure portfolios. It calls for diversifying your exposure not only to various asset classes but also to different strategies that behave differently as market regimes change – algorithmic or not.
We’re thankful for your continued interest. As always, please reach out any time with your questions and feedback. Our team spent the last week in New Orleans for a conference with the International Foundation of Employee Benefit Plans. It was great to catch up with some old friends and make many new ones. We have trips planned to Asheville, NC, Northeast Georgia, New York, DC, and Baltimore over the next several weeks before settling in for the holidays. If any of you are interested in getting together while we’re in town, please drop us a line!
Sincerely,
Arthur Grizzle & Charles Culver
Managing Partners
Martello Investments