You Just Inherited a Trust: Now What?

Learning that you inherited money comes with complicated emotions as it is. When a lawyer presents you with a binder full of trust documents as you grieve the loss a loved one, it can cause frustration and confusion to skyrocket.

It is preferable to have these conversations while your loved ones are still living, so you are prepared. If that isn’t, the case, however, here are a few steps you can take to get caught up to speed.

Get To Know Your Team

Often, a trust will have (or should have) multiple professionals involved to help ensure it is managed properly. It is prudent for the beneficiary to meet with various members of the team to get your questions answered.

Learn About Distribution Restrictions On The Inherited Trust

When you inherit a trust, there are sometimes restrictions on your ability to withdraw funds. Gaining a thorough understanding of these restrictions through consultation with your team can help you better plan for the future.

For example, there may be an age restriction on the inherited trust which only allows distributions after a beneficiary reaches a certain age. Or there may be an interest designation, which allows beneficiaries only to withdraw interest from the trust, leaving the principal intact for future generations.

Another common restriction is the so-called “HEMS” standard, which stands for health, education, maintenance and support. In this case, the trustee must approve expenses that qualify with the HEMS criteria.

Understand The Trust's Investment Policy

If you have an investment advisor overseeing the trust’s portfolio, it is important for you to understand the investment plan. Depending on the terms of the inherited trust, you may or may not have the ability to alter the investment plan. Even if you can’t change the way the assets in the trust are invested, it is still worth understanding. You want to consider the way those assets are invested in the context of your broader portfolio and financial plan. For example, it may be prudent to adjust your risk tolerance elsewhere, such as your 401k or other investment accounts.

The complex emotions of losing a loved one and inheriting a trust can feel overwhelming. Instantly gaining more wealth through inheritance can bring on both additional security and new fears.

We believe the biggest mistake you can make in this scenario is to rush your decisions. Instead, take a step back, ask plenty of questions, and evaluate your options. An important consideration is how you want this newfound wealth to impact your life. An inherited trust may, for example, help ensure your own retirement, allow you to give back to your community, or consider future generations through ongoing estate planning.

If you have questions about trusts or other estate topics, please schedule a complimentary consultation with one of our advisors.

Saving for Retirement Just Got Easier

It seems so rare these days that we can celebrate any news coming out of Washington. But two recent actions by the government should be celebrated, because they are helping Americans’ ability to save for retirement. Let’s breakdown two of the big changes:

1. You can now save more in tax-advantaged retirement funds (401k, IRA, Roth)

For employer-sponsored plans, such as 401k and 403b accounts, the annual contribution limit was increased from 20,500 to 22,500. This is a response by the government to high inflation, which clocked in at over 7% in November. While $2,000/year doesn’t seem like a big deal, it is, especially for early and mid-career professionals with many years until retirement. Over a long period of time (say 25 years), a $2,000 extra annual contribution could mean an additional $100k-$150k in retirement!

What about for savers closer to retirement? The IRS has something for you, too, with an improvement to the catch-up contribution amount. The catch-up contribution is an extra amount you can contribute to your retirement accounts if you’re over the age of 50. For 2023, the catch-up contribution limit was increased to $7,500 from $6,500 for 401k and 403b plans. So, if you’re over 50, the maximum amount you can contribute is $30,000, up from $27,000.

For people who have an IRA or Roth IRA, annual contribution limits have increased for both by $500 to $6,500 for eligible individuals. The IRS did not raise the catch-up contribution amount for traditional or Roth IRAs. Roth IRAs are available to certain income brackets only. In 2023, the amount you can contribute to an Roth is phased out once your income reaches $138,000 for single filers ($218,000 for Married Filing Jointly). Once income reached $153,000 for single filers ($228,000 for Married Filing Jointly), savers are not eligible for Roth IRA contributions at all.

2. SECURE 2.0 Act allows 529-to-Roth rollovers

Prior to the law’s passage, funds distributed out of a 529 college savings plan used for anything other than education expenses would incur penalties and taxes. This led savers to worry that if they overfunded their kids’ college education, or the kids end up not needing it, funds would be stuck in the 529 or subject to penalties.

The new provision gives parents a lot more flexibility with these education savings. Beginning in 2024, beneficiaries can roll up to $35,000 in total to a Roth IRA, subject to annual contribution limits. This means you can reallocate tax-advantaged funds set aside for education expenses towards your or your children’s retirement.  This is also an interesting way to “back-door” Roth contributions, because 529-to-Roth rollovers are not subject to the income limits discussed above. However, the 529 account does need to be open for at least 15 years prior to a Roth rollover.

The SECURE 2.0 Act has many other impacts on retirement savings, no matter your career stage. If you’d like to review your retirement plan, please schedule a call with one of our advisors for a no-obligation, no-pressure consultation.  

Just Meh

Summary

Meh Markets: Though stocks have fallen considerably this year, valuation in equity markets remains mixed, but down from extremely overvalued levels.

What now for fixed income?: Rising interest rates have improved the risk/return profile of investment grade bonds. Currently, lower-grade bonds still seem risky based on tight credit spreads.

Somebody’s got it wrong in real estate: A huge, unsustainable spread has opened up between public and private real estate values.

What a year!

War in Europe, political unrest across many major companies, inflation, economic uncertainty, rising rates, stock markets falling, and most importantly to certain corners of the internet, the collapse of multiple cryptocurrency scam companies. I’d imagine many of you are ready to close the books on 2022 and start anew next year.

Indeed, after a small head fake to start the fourth quarter, it seems that the stock market is going to lifelessly fade into the end of the year. Despite that, we see in the ashes of the selloff this year the smallest green shoots of opportunity emerging in some asset classes.

“Wait!” you say – there’s a recession coming! Markets always crash during a recession, right? Well, no. A recent article in Forbes shows the counterintuitive results of a study by Darrow Wealth Management that in the recessions since 1953, stocks fall most in the lead-up to recession rather than during the recession itself. There’s a lot to unpack here; the key point is that every recession is different, and the market’s reaction to the recessionary period (before, during, and after), isn’t set in stone. The S&P 500 has fallen nearly 30% this year peak-to-trough. Could it fall more in a recession? Yes, certainly. But based on history it’s far from certain. Stocks aren’t the only affected asset class. The pronounced rise in interest rates has reset values across all asset classes, some of which will perform better in recessions than others.

Meh Markets

So, doom and gloom isn’t guaranteed if we go into recession next year, but what do we think about the stock market now?  It’s a very unsexy take, but I am not ready to take a strong stance on the current market either way. I think the best way to describe our current outlook is... Meh, with perhaps a shrug thrown in for emphasis. Looking at equity valuations, for example, signals look pretty mixed: the S&P 500’s Price/Earnings Ratio recently crossed under its 50-year average after spending years above it, indicating that valuation is improving; Shiller’s cyclically adjusted price/earnings ratio (CAPE) is above its long-term average, but not at the extreme levels of overvaluation we’ve seen in previous years.

However, when you compare the market’s P/E to the level of interest rates, you’ll note that on a historical basis, current interest rate levels typically coincide with much cheaper valuations than we see currently. What does this mean in aggregate? Valuation is improving but is certainly not at levels that would make us pound the table and scream buy, buy, buy.

One area of extreme market clarity is the punishing losses in the “hyper-growth” stocks. We refer to this as the Tech Wreck 2.0, due to its similarity to the Dot-Com Bubble Bust in the early 2000s. You can see this in the chart below, which compares the NASDAQ from 1999-2002 to the ARK Innovation Fund ETF (ARKK) as a proxy for today’s hyper-growth universe.

The cohort of companies that launched via SPAC are another excellent example. I am very confident that the next wave of generation-defining products and world-leading companies will emerge from this wreckage. The question for investors is always which companies will be successful and which ones will fail. Put another way, as this current growth stock bust turns to boom, who will become as the next Amazon or Google, and who will be left on the scrap heap of history with Pets.com and AskJeevs?

What now for bonds?

For a generation or more, the financial community was pretty much in lockstep on the role of bonds in a portfolio. Fixed income is supposed to provide a mix of current income and diversification to help protect accounts during times of equity market weakness. For most of the last 50 years, this has been a reliable relationship. Inflation, almost by definition coupled with rising interest rates, challenges these preconceived notions, however. We wrote about this many times over the years, as it was clear that an unwinding of global zero/negative interest rate policy and potential inflation would cause this “short correlation” assumption to no longer hold. Indeed, at one point this year, long-duration fixed income was down as much as 37% and continues to underperform the S&P 500 on a year-to-date basis.

An interesting question now is how to think about fixed income moving forward given elevated rates, high-but-falling inflation, and prospects for a recession next year. Yes, yields are higher across the board, but how do investors measure value in this climate? We like the concept of yield per unit of duration, also known as the Sherman Ratio. This gives investors a sense of how well they are compensated for taking interest rate risk. By dividing yield by duration, the Sherman Ratio tells you how much rates must rise to cause price depreciation in the bond large enough to wipe out a full year’s worth of bond interest. Remember, if interest rates go up, the price of a fixed-rate bond will fall. Looking at the Bloomberg US Aggregate TR – Intermediate Index as a benchmark, we can see the pretty dramatic improvement in the “value” of taking interest rate risk. The Sherman Ratio on the index bottomed out at 0.23 in early 2021, as interest rates plummeted to historic lows. Again, this means that interest rates would only need to rise 0.23% for the price losses to offset all of the bond’s interest for a year. Since that time, the Sherman Ratio on the index has improved by over 4X, closing October at 1.02. By this metric, core fixed income is as compelling as any time in last decade, at least on this risk-adjusted basis.

Link to original article: https://www.northwesternmutual.com/life-and-money/fixed-income-the-case-against-piling-into-cash/

Contrasted against the growing value in investment grade fixed income, the high yield credit market doesn’t look as attractive to us by comparison. Sure, yields available on junk bonds have risen along with everything else. Credit spreads, however, remain near historically tight levels, reflecting investor optimism about less creditworthy borrowers’ ability to navigate an economic recession.

Somebody’s got it wrong in the real estate market

A recent paper by Janus Henderson shows the widening gap between valuations of public real estate vehicles (Public REITs) and private real estate funds. Janus’ research shows this gap forming only at times of considerable market turmoil, with notable examples in 2000, 2008, and today. Indeed, at the time of this writing the Vanguard Real Estate ETF (VNQ) is down over 20% on the year while the NCREIF ODCE Index, which tracks private open-ended real estate funds, is up over 13% YTD through the third quarter. I’m sympathetic to the view that some private investments can deliver a premium to investors, but that’s not what’s going on here.  

Source: Janus Henderson. Link to original article. https://www.janushenderson.com/en-us/investor/article/public-vs-private-real-estate-similar-assets-different-prices/

What could be causing this gap? Maybe an overreaction to rising rates and fear of recession disproportionately impacting the publicly traded funds, which are more easily sold than their private counterparts? Perhaps the private funds are battling to defend their property valuations to the death, with poor marks in these funds inevitably to follow only once these stale valuations become untenable? Perhaps both? We think investors, particularly with a long-term view, can begin looking to the public real estate market as a potential opportunity to pick up attractive yields, though we encourage investors to be selective. We favor specialty real estate asset classes with business models that are, in our view, more resilient to economic disruption. Yields and valuations aren’t at “load up the truck” levels yet, and these assets could fall further, but the sell-off has caused us to give the REIT market a long look.

Closing Note

The common thread throughout the themes we discuss above is that it is important to pick your spots when times are tough. Things have changed. We’re certainly not in the risk-on/risk-off framework that characterized so much of the post-Great Financial Crisis decade. Certain segments of markets look better than others to us. That’s not to say that stocks couldn’t fall further, or rates won’t take another sharp move higher. Those scenarios are possible, but our view is that decision-making in investing should be more a continuum than a single datapoint. As we sit here, with equities 20% off their highs, interest rates at near decade highs, and 5 consecutive months of disinflation, some opportunities seem to be emerging. Incrementally. Nobody is going to waddle out on to CNBC, ring a bell, and let you know when to pile in. Would you believe them if they did?

Stay safe out there, and happy holidays.

Artie

Martello Investments Rated Top 21 Firm by Expertise.com

Norfolk, Virginia, United States (April 28, 2022) - Martello Investments, a wealth management firm headquartered in Norfolk, Virginia, is pleased to announce its recent recognition as a Top 21 Financial Advisory Firm in Hampton Roads and Norfolk by Expertise.com.

Expertise.com, a database of top service professionals across the U.S., identified and scored 74 financial advisors in Hampton Roads, including Norfolk, Virginia Beach, Newport News, Hampton, and Portsmouth. The list was narrowed to the top 21 advisors based on 25 variables across five categories: availability, qualifications, reputation, experience, and professionalism.

To rank the companies, Expertise.com hired mystery "shoppers" who anonymously contacted the firms and evaluated them based on several categories. The firms who responded quickly, answered questions thoroughly, communicated politely and professionally, and demonstrated outstanding financial expertise and experience scored highest among the list.

As a result, Martello Investments scored an 'A+' in professionalism, responsiveness, friendliness, helpfulness, and detail. The score demonstrates the firm’s dedication to providing best-in-class service to its clients.

“We’re very proud to be recognized by expertise.com as a top financial advisory firm in the Hampton Roads area,” said Arthur Grizzle, founder and managing partner at Martello Investments. “Excellent client service is a core mission of Martello, so we were pleased to see our team rated very highly in those categories.”

To see the full list of the Top 21 Financial Advisory firms in Hampton Roads, as well as Martello’s full listing and detailed scores, please click here.

About Martello Investments LLC

Martello Investments LLC is an independent wealth management and advisory firm based in Norfolk, Virginia, serving clients across the country. The firm was established in 2017 by Arthur Grizzle, CFA and Charles Culver, CFP®. Martello’s investment services include retirement portfolio strategies, multi-generational investing, and values-based portfolios. Along with investments, the Martello team focuses on all aspects of a client’s financial well-being through evidence-based comprehensive financial planning. Martello’s independent structure and fiduciary commitment means client needs are prioritized every step of the way. For more information, visit www.martelloinvestments.com.

Alphabet Soup

If you’ve been brave enough to turn on financial television in the last 3 months, you’ve heard it. The game is speculating on the “letter” of the recovery as the economy normalizes following the coronavirus. Are you a V-recovery person, who thinks everything will snap back to normal as soon as the virus subsides? Less optimistic? Maybe you’re a U. Expecting a double dip, which would make you a W? Expecting no recovery at all? You’d be a L-shape recovery kind of person. As each day concludes, the virus leaves us with an O, going around and around in a circle with no end in sight. As if this game of recovery letter scrabble wasn’t enough, the government response to the coronavirus has presented business owners, employees, and investors with a dizzying array of acronyms. In the last few months, we’ve been introduced to PPP, EIDL, TALF, CARES, HEROES, and others, all of which are designed to help combat the financial and economic hardship brought on by the pandemic.

While some response was required to combat the “economic induced coma” created by travel bans and forced business closures, what’s lost in this alphabet soup of government programs is that the Fed and Treasury Department have crossed the Rubicon in terms of market intervention. Yes, credit markets froze and stocks plummeted in March. The Fed responded by cutting rates and reinitiating its Term Asset-Backed Loan Facility (TALF) program, which was a great success in its previous incarnation during the Financial Crisis in 2008-2009. TALF provides institutional investors with cheap leverage to acquire AAA rated asset-backed securities, providing a nice return opportunity while stimulating lending markets. This type of stimulus is at least familiar, as it’s focused on stimulating markets through manipulating broad pools of securities. It also leaves security selection to professional allocators.

The subsequent announcements – that the Fed will buy corporate bonds (including those rated junk) through ETF purchases and individual bond purchases are more troubling. The decision to purchase individual corporate bonds as part of the CARES program is a bridge too far. The Fed announces such programs just so it doesn’t have to use them. To instill a bit of confidence in the system. And it worked. But on June 16 (the only day reported thus far), the Fed purchased $207 million of individual corporate bonds as described in its disclosures posted here under the Secondary Market Corporate Credit Facility section. The Fed is building a large book based on an index it created to get around a game of political football. Now that the Fed is operating as a credit fund in the business of owning individual securities and taking idiosyncratic risk, it requires only the tiniest leap for the central bank to start mirroring the Bank of Japan, which continues buying trillions of Yen in Japanese stocks.

Remember the good old days, back when struggling companies had to pay for their capital? Where actions had consequences? In the Great Financial Crisis of 2007-2009, the American taxpayer was at least partially compensated for absorbing the risk of reckless businesses because the federal government took an equity stake in AIG and the automakers. This time around, the airlines just backed up a truck to the Treasury, received billions of dollars in emergency funds, gave up no equity (other than limited warrant packages), did not pay a market interest rate, and made no long-term commitments to its workforce. Boeing, a company whose troubles long predate the virus, at least only used the American taxpayers as a stalking horse before raising funds through a private bond offering, including a 40-year-to-maturity tranche at less than 6% interest. Publicly traded companies abused the PPP program at the expense of small business owners, stopping only after a significant public shaming.

That doesn’t even consider the indirect ways that the Fed’s actions over time have distorted the most basic of investor behaviors. Despite the unprecedented economic uncertainty caused by the virus, both debt and equity issuance are surging. Is this a normally functioning market? Think about this: Hertz Global Holdings filed for bankruptcy, and then its stock went up nearly 10X. What causes that other than investor expectation of an equity-saving bailout?  Some might argue that retail investors are bored and a large number of them bought the stock seeing a deal without understanding the consequences of bankruptcy (your value goes to zero). However, when it was trading above $10 before March 6th, the average trading volume was in the range of 3-7 million shares per day. Right after it filed for bankruptcy, the share price went as low as $0.40 and for those first three days 609 million shares changed hands. I could be wrong, but that doesn’t seem like it’s just retail. Even now, with its stock price (somehow) higher, it still trades regularly with hundreds of millions of shares changing hands daily as it makes the news. And then the company nearly pulled off the unthinkable, as only a last-minute SEC intervention paused Hertz’ plans to sell nearly $1 billion in new (worthless) stock directly to the market while still in Chapter 11. This is the greater fool theory run amok.

There has been a lot of punditry about the other moral hazards created in the government’s response to the crisis, with many pointing to the working poor making more money through enhanced unemployment than they would at work, and those lucky enough to keep their job still receiving stimulus money. This kick down the ladder is typical of Wall Street. Many ask why the average family can’t withstand a couple months of lockdown; I’ve heard far less outrage that Delta and American Air don’t have a few months of expenses in cash on hand. Hey, stock buybacks fueled in part by cheap debt (the airlines bought nearly $40 billion of their own stock from 2015-2019) and misallocation of resources have consequences. Look, we’re not opposed to stock buybacks. They’re a perfectly reasonable way to return capital to investors in a tax-efficient manner. But this torrid pace of buybacks was a capital allocation decision made by executives, and that it left them so thoroughly unprepared to handle a crisis is a shame. Risk in business and investing is ubiquitous. Equity investors are compensated for taking this risk through owning a share of profits, but if the business falters they take losses or potentially get zeroed out. That is how capitalism functions. Or you could just bank on a bailout.

I’ve heard even less discussion about the decades-long societal trends that have created this fragile of a populace and economic system. That over half of households are unequipped to handle a temporary economic hardship is a tragedy. The death of retirement savings through destruction of the pension system coupled with stagnating real wages, the rise of the gig economy, and punishment of savings through structurally low interest rates have crippled the working class’ ability to withstand a crisis.

America’s 50-year communion at the altar of corporatism has changed the way we define productive businesses, conflating profit and production with a rising stock price. This distorted view of capitalism has left regulators and politicians more desperate to prop up stock prices as a reflection of the real economy. This stock market is valued at levels rivaled only by the start of the great depression in 1929 and the dot com bubble of the early 2000s (based on the Shiller Total Return CAPE ratio, which admittedly has its drawbacks) despite a recession, more than 40 million unemployed at peak, and rising COVID infections day after day. How does one reconcile these valuations with a country which is on a path to more infections, more unemployment, lower earnings levels, and more bankruptcies? It only makes sense if you consider the Fed’s policies and intervention, which it seems has been all that anyone needed to hear in order to feel confident about the markets.

And that’s just the problem. As people become more used to being able to rely on the Fed when times get tough, the Fed will find itself filling that role more often. As we see a market more susceptible to shocks, what sort of arsenal can the Fed continue to employ to keep markets calm? The Fed is supposed to be the lender of last resort, not a tactical corporate bond trading shop. How long until the central bank turns to the equity market to quiet investor pessimism and volatility? How on Earth will they ever unwind this trade? Any objective look at a chart of the Federal Funds rate or the Fed’s balance sheet shows that a full unwind is not really in the cards.

Look, we’re not saying that this is the end of the world. To reiterate, the Fed needed to fulfill its duties to ensure credit markets didn’t lock up. But we don’t like how it’s almost being taken for granted; the expectation is the source of the moral hazard we fear. When everyone starts to go out on a limb so much that the Fed has no choice but to intervene in order to save everyone from themselves, we don’t have true capitalism anymore, but rather a perverse version of it where gains are privatized and we all eat the losses.

Arthur Grizzle & Charles Culver
Managing Partners
Martello Investments

February 2020 - Puke Points

According to legend, he was known amongst his peers for his sense of honor and his integrity in the pit. Though he died from lymphoma at 39 in 1991, there remains a 2-hour video lecture he gave to new floor traders in 1989 available here. I like to watch his lecture for a few reasons. First, it simply makes me feel better that whatever my trading-related headache for the day, I’m glad that I can do it from the relative comfort of a computer screen instead of how they did it back then. In Charlie D’s world, I would have had to call up the broker, scream at a guy through the phone, who would in turn have to scream at another guy to relay what I wanted to do, who would then have to scream at yet another guy to actually get the order done. Complaining about tabs versus spaces in our upload file or repeated pop ups seem like small problems when put in that context.

I know I’m a trading history nerd, but Charlie D’s lecture should be required listening for every trader and financial advisor because it is full of gems. Over 2 hours, he covers trading psychology: when to get out, how to take a loss, how to take a gain, and managing risk systematically. A few examples:

Most importantly, he discusses the value of having a puke point. A puke point is the mechanism that allows you to take your lumps in a losing trade and live to fight another day. From Charlie D:

“You’ve gotta have a puke point. When you’re long at 4, don’t look to buy ’em at 2…You want to get out! You want to throw those contracts up all over your shoes.  That’s a puke point. The people that do the best in here are people that have a low puke point. When you have a position on that goes against you, you gotta get out.”

A puke point is about more than taking a loss in the purest trading sense. It speaks to the way a person processes information. We know from behavioral finance that most investors act irrationally handling gains and losses, opting to cut their gains early and let losses cascade. This has as much to do with banking profit or admitting defeat as it does with addressing how we process new information in a biased way. Our brains are naturally biased against disconfirmatory evidence, opting to place greater emphasis on information that agrees with our preconceived biases. This nasty cognitive defect, which social scientists attribute to our evolutionary need to trust each other, is a contributing factor to the best and the worst of us. Sure, it contributes to our inability to initially grasp when we are defrauded or betrayed, but it also allows us to form meaningful relationships. You win some, you lose some. Those with a low puke point run at the first sight of danger, while those with a high puke point require many shots of disconfirming evidence to change paths.

When we think about the evolution of the market over the last decade, we can only conclude that the market collectively has developed an unshakeable belief in the sustainability of rising prices. This is driven by several factors, not the least of which is the continued faith in the ability of the biggest sugar daddy of them all, the Federal Reserve, to step in and calm markets when called upon. This allows market participants to shake off bad news (an earnings recession in the United States, slowing growth, a weak and temporary resolution to a trade deal, and lately the potential global pandemic in the form of coronavirus) all the while marching to record highs. Some folks call this complacency; Charlie D would call it a high puke point, and he would be appalled to see it virtually everywhere.

The thing about complacency: it’s fine until it’s not. Everything appears normal until the exact moment you throw up all over your shoes. If you have kids, you know. The action over the last two days has laid bare what happens when a very tolerant market is awakened after many quarters of ignoring bad news. The last two days, each of which saw an S&P 500 return down more than 3%, is astronomical by the financial world’s standards. Let’s take a deeper look at that:

The long-run standard deviation of stock returns is roughly 1% daily. According to statistics, a down-three-standard-deviation event should occur approximately once every three years or so (1 in 741 days, or 0.135% of the time, based on 252 trading days in a year). The probability of two consecutive days like that is predicted to be once every 2,117 years (0.135% * 0.135% of the time). And this isn’t the first time we’ve seen these kinds of statistical oddities in the market. In fact, the market has been down three standard deviations for two consecutive days a total of 8 times in just the past twenty years. Unfortunately, the real conclusion here is that reality is a poor match for the theoretical statistical framework under which the entire financial industry operates, but that’s a great topic for another day.

It’s not as though the coronavirus, the headline cause for the increased volatility, appeared out of nowhere over the weekend and spooked the market. The seriousness of the virus has built for weeks while the market was missing its puke point! Only after an announcement of new disease clusters in Europe, South Korea, and Iran did the market even begin to price in the potential global deflationary impact of a pandemic. This will ultimately play out one of two ways. It could, like the swine flu hysteria or the most recent Ebola scare, peter out after a few months when global health authorities get it under control. Or, it could result in a more serious pandemic. It’s obviously impossible to know now. Personally, I believe in the ability of the medical community to find solutions. And the White House recently announced a $2.5 billion plan to combat the virus through additional funding for vaccines, treatments, and protective equipment.

Coronavirus aside, a clear-eyed view of the market leaves us with these sobering truths:

Will this lead to a more significant correction in stocks than the 6% or so that we’ve seen over the last two days? Who knows. Still, the stock market’s inability to price the risk of this virus incrementally should be troubling to all investors. We have seen these increasing risks reflected in the bond market over the last several months, with the US 30-year treasury yield falling to unprecedented levels, touching 1.8% yesterday.  We feel strongly that the market reaction to this news is just the latest example of structural weakness that we have highlighted in many of our previous letters . Whether the texture of the next significant correction for equity markets will look more like 1937, 1987, or 2007 is a complete unknown, but given the seeming inability of the market to process negative information efficiently, we expect that we are in for more events like the last 2 days and the volatility blowup of February 2018, where equities fall sharply in very short periods of time. In such an environment, many traditional risk management metrics like momentum trading or moving averages are, as my grandmother used to say while dealing weak cards in nickel poker, “no apparent help.” Market shocks are necessarily against consensus, that’s what makes them shocks.

Yack.

Be safe out there.

Artie

April 2019 - Unproductive Gains and the Power of Losses

In fact, one of the dirty secrets of the industry is that terms like financial advisor, investment advisor, financial planner, consultant, etc. don’t mean much in terms of experience. Unlike the term “medical doctor,” where the patient can be reasonably certain the individual performing services has received the requisite amount of training, education, real-world experience, and testing required to obtain the title “medical doctor” – and has been subsequently licensed by the medical board. State and federal securities regulators mandate that everyone is licensed (or exempted, through one of five certifications/accreditations). These licensure tests make sure to cover the law, ethics, and a small amount of finance theory. Knowing and following the law should certainly be a primary focus, but in the case of these tests it is the primary focus. There is no deep dive into financial topics – just a light check to see you know enough to start out in the industry. But not breaking the law does not translate to not breaking the client’s bank account. It is amazing to think that there is no standardized education for the industry; many professionals take their lumps and learn through painful experience, except those lessons learned are almost without exception with clients’ money.But this is not a piece about how the industry needs to rally and root out the bad eggs. It’s more to share with you a simple piece of information that may have slipped by you if you don’t have a thoughtful advisor that is more concerned with wealth preservation and growth than their monthly commission check. If there were a School For Investors, INV 101 would include some version of the chart below. Many advisors refer to this chart when educating clients on the need for diversification, avoiding risk, and limiting loss. Though many professionals have been taught to estimate risk by solely looking at an investment’s volatility (the magnitude of its returns over time, both up and down), even the most novice investor will tell you that his or her real worry is losing money. Long-term or permanent loss of capital is devastating for wealth creation, and it goes without saying that the more an investment loses, the harder it is to get back to even. Here’s a quick example:

Suppose a $100,000 portfolio loses 20% one year and gains 20% in the next. Though the “average return” is zero, the investor actually loses money over the two-year period. In the first year, the portfolio loses 20%, or $20,000, to finish the year at $80,000. The next year, the portfolio gains 20% of $80,000, or $16,000, to finish the year at $96,000. In order to fully recover the $20,000 loss in the second year, the portfolio would have needed to gain 25% on $80,000. If the investor first gained 20% followed by a 20% loss, the end results are the same - $96,000. This effect is more pronounced as losses worsen. A 50% loss, for example, requires a 100% gain (meaning the portfolio must double) to get back to even. Such a large loss generally leads to prolonged recovery periods. In the Great Financial Crisis, the S&P 500 Index lost nearly 51% from Nov 2007 – Feb 2009 and did not recover those losses until March 2012. This means the Index went 52 months without any new gains.

The last two quarters perfectly displayed the impact of volatility drag. The fourth quarter of 2018 was horrible for the stock market; the -13.52% quarterly return for the S&P 500 was the 5th worst quarter in the last 20 years and compares to quarterly returns experienced in the depths of the financial crisis, the technology bubble bust, and the European debt crisis of 2010-2011. In the first quarter of 2019, the S&P 500 came roaring back, mostly due to a seemingly imminent conclusion to the trade dispute with China (which still at the time of this writing has yet to be resolved) and a more cautious Fed, which opted to pause its rate hikes indefinitely rather than continue raising them as it had planned to do. For the quarter, the index gained 13.65%, which is the 5th best quarter in the last 20 years. So, does a -13.52% quarter followed by a 13.65% gain equal a positive return over the 6-month period? No, it equals a 1.7% loss. The market would have needed to gain over 15.6% to fully recover the losses from the prior quarter.

Last month, our friends at CMG (Capital Management Group) did a webinar with ETFTrends and VanEck where they discussed how to survive market volatility. In it, they presented an interesting study by Ned Davis Research which showed that over the last 90 years, markets reached new highs only 34% of the time. The remaining 66% of the time was spent in a falling market (23%) or in recovery from a fallen market (43%). This means that, at least for buy and hold investors, markets were generating new wealth approximately one third of the time, a segment referred to as “New Wealth Creation Opportunities” in the chart below. This is a critical point: if a market is not reaching a new high, it is merely recovering a previous loss and therefore is not generating new wealth.

There are ways to make portfolios more efficient, more resilient, and more primed for new gains. This necessarily revolves around reducing portfolio drawdowns. Minimizing losses keeps an investor’s wealth nearer to its highs, which allows new wealth to be generated more easily. For most investors looking to improve the ratio of wealth creation opportunities, we advocate implementing a mix of the following:

  1. Income: Boiled down to its core, investing is about finding neat ways to get paid for taking risk. For example, when you buy a growth stock, you get paid with long-term earnings growth (and hopefully the stock price growth to match) but take the risk that the company won’t make it. Investing in income-producing assets like bonds or dividend-paying stocks ensures that investors are paid tangibly to take risk, and the reinvestment of investment income obviously improves the ability of a portfolio to compound wealth over the long term. In fact, the study cited above is based solely on price performance of the S&P 500 (it does not include return attributed to dividends) and including the income element of stocks would certainly improve the wealth creation characteristics over time but would not fully eliminate the volatility drag of large drawdowns.
  2. Diversification: We have touched on diversification in various forms in previous notes, but the loss-dampening effects of including, for example, a mix of stocks and bonds in a portfolio helps insulate a portfolio from the wealth destruction of large losses. Also, frequent rebalancing of a diversified portfolio helps investors take gains from the best performing assets and add to asset classes that have fallen, which takes advantage of the cyclicality of markets over time.
  3. Allocations to Alternatives: the term “Alternatives” is a broad brush stroke that can mean any of a number of different strategy types, each with its own risk profile and ability to protect investor capital. We focus on developing and allocating to data-dependent strategies that can reduce risk when market environments are uncertain and in some cases, can capitalize on falling prices. Other investment options that target these same characteristics are certain segments of the hedge fund universe, though hedge funds in general suffered disappointing performance in 2018 and have not bounced back as well along with equity markets so far this year.

No single approach to building portfolios is a panacea, which is why we advocate a blend. Over time, our view is that this focus, implemented in a disciplined format, will help keep investors producing more wealth by avoiding the devastating impact of losses. When it comes to the current market outlook, our data tells us that the picture is mixed. On the positive side, markets are rallying, earnings season is off to a great start, the Fed seems content with its interest rate level for now and has opted to pause its hikes. However, global growth appears to be slowing, with the IMF cutting its 2019 forecast once again. The yield curve in the US remains inverted out to 7-years at the time of this writing and home & auto sales have also been very weak. The yield curve and home/auto sales data are both worrying; these signals are typically indicative of future recession. At the same time, valuations remain near historically extreme levels despite growing earnings. If a recession is accompanied by a bear market, as has been the case several times over the last few decades, losses would likely be significant. To be clear, the immediate and nearly full snapback experienced in the first quarter of 2019 is a very rare phenomenon for equity markets, and investors shouldn’t rely on risk management to continue to come in the form of a soothsaying Fed. Large losses are not typically recovered quickly; as mentioned above, it took buy and hold equity investors over 4 years to recover from the losses in the last crisis, using the S&P 500 as a proxy. In a more stunning example, the technology-heavy NASDAQ Composite didn’t recover it’s February 2000 high until 2014, meaning investors went nearly 15 years without any new wealth creation – and that’s not even adjusting for inflation. If you do adjust for inflation, the NASDAQ Composite didn’t recover its February 2000 high until late 2017. For some investors with an ultra-long-time horizon, maybe that is a risk you are willing to take. For most, though, it may be wise to include other approaches that focus on “New Wealth Creation Opportunities” by limiting the impact of market downturns.Thank you to everyone for your feedback. Please feel free to reach out at any time with questions or comments.

Sincerely,

Arthur Grizzle & Charles Culver
Managing Partners
Martello Investments

January 2019 - Bitcoin Bubbles & Beanie Babies

Think back to this time last year. Consider how much has changed. Equity markets were ripping to new highs on the back of a stimulative tax cut, whispers of inflation were beginning to surface, and sentiment was reaching historically bullish levels. Now, just a short time later, the S&P 500 plunged over 9% in December to bring 2018 returns to negative – the worst year for the market since the Great Financial Crisis.

Investors are spooked that the Fed has overshot with its rate hike path. More drastic than the stock market, though, is the swift and dramatic change in the niche cryptocurrency market, plucked from relative obscurity to reach full-blown mania in 2017, soon followed by an incredible bust in 2018. The proliferation of cryptocurrency is thought to be a potentially disruptive force in several areas of commerce, but the volatility in the coins using this technology has led to massive sentiment-driven swings in value. After the two most popular cryptocurrencies (Bitcoin and Ethereum) each went up over 10-fold in 2017, both have collapsed during 2018 by over 75% so far, hampered by regulatory concerns and waning institutional interest.

If there is a definitional example of a mania in modern times, the cryptocurrency phenomenon of 2016-2018 rivals only the dot-com bust in the late 1990s-early 2000s (or Beanie Babies, but we’ll get to that later). All the classic signs of a bubble were present from an explosion in ICOs (initial coin offerings – the cryptocurrency market’s complement to a stock IPO) to an increase in fraud and institutional capitulation. Over $5 billion was raised in ICOs in all of 2017 and more than $6 billion was raised through ICOs in just the first quarter of 2018. A study by cryptocurrency advisory firm Statis identified over 80% of these offerings as scams. Several news stories identified companies that added “blockchain” to their names only to see their stock prices rocket higher, despite their unrelated principal businesses ranging from biotechnology to bottled iced tea, which is reminiscent of the “pets.com” madness of the dot-com era. Individual investors with no knowledge of the cryptocurrency market (other than its grand rise) nor the underlying technology found themselves investing their life savings in it.

In addition to the unfortunate individual interest, 2017 also saw institutional interest in the cyrptocurrency market gain steam as several Wall Street blue chips opened market-making operations. New crypto-related indices were created, Bitcoin futures were launched at the CME, and several institutional money managers identified cryptocurrency as a source of “uncorrelated alpha.” As we began to evaluate a few of the exchange-traded Bitcoin products, we learned that they traded at huge premiums to their underlying assets, reflecting insane levels of optimism by speculators. We also learned through industry scuttlebutt that many hedge funds had begun dabbling in trading the cryptocurrencies if not outright mining them, while others were allocating a decent portion of NAV to investing in this new asset class for the long term.

Now, over a year later, many of those institutional crypto desks have quietly shuttered. The volume and open interest of the Bitcoin futures market has failed to show traction, the kiss of death for any new product in financial markets. The previously excited hedge funds have stopped talking about it. This is understandable given that the HFR Cryptocurrency Index is down 66.82% YTD through November. The SEC has rejected several applications for new exchange-traded products based on crypto, a few of which had up to 300% leverage attached. Regulators are cracking down on bogus coin marketing schemes. And some of the most popular coins have plunged in value by more than 80%.

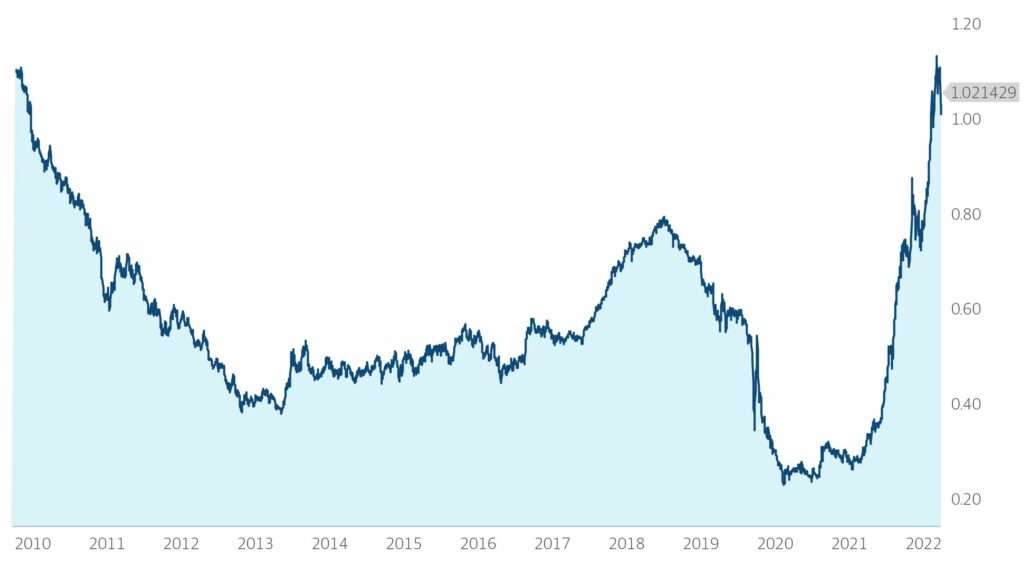
As the fall continues, with Bitcoin breaking below $4,000 USD/BTC after peaking near $20,000, the logical question is where the crypto market is heading. And it’s truly a question; the cryptocurrency market has shown strikingly similar behavior before. Bitcoin went all the way from $117 on May 1, 2013 to $1,151 on December 4, 2013 before making its way back down to $375 on December 6, 2014. The most recent time period occupying the same number of days exhibited very similar behavior: starting May 19, 2017 at a value of $1,988, it peaks on December 16th, 2017 at a closing price of $19,497 (it did briefly touch a bit higher the next day) and follows up with a decline to $4,079 on December 24, 2018.

Looking at the chart above, you can see that this recent bout of volatility is nothing new for Bitcoin and one should not lightly conclude that it has run its course on price action alone, which many are doing. In fact, one could argue that the 2013-2014 period was more volatile and exhibited more bubble-like features than the more recent period because the increase in price happened much quicker than the more recent one. The most recent loss in value is simply its most public one. But, please don’t take this to mean that we think these sudden run-ups in value will become a recurring theme. In financial markets, one rarely finds something that repeatedly and predictably happens. With Bitcoin, we believe that the last time was most likely the last time.

For one, you’ve got the public nature of its crash. My grandmother now knows what Bitcoin is. I mean, she doesn’t understand it, but she knows that it went through a little bit of a “rough patch.” My grandmother doesn’t like to invest in things she knows are volatile. Most others don’t either, and now you’ve got a “fooled me once” mentality among the masses where you did not before.

Second, financial regulators are now more aware than ever of Bitcoin and of the cryptocurrency market in general. They’re starting to crack down on those that advise on it without registering as an investment advisor and those that issue ICOs without going through the formal process of registering a public security. China outright banned Bitcoin trading while the US and EU are forcing Bitcoin custodians to follow Know Your Client and Anti-Money Laundering regulations that apply to all other custodians. The IRS and other tax-collecting entities across the world are beginning to use that data to find and fine those that don’t pay taxes on their cryptocurrency gains. Other three-letter agencies have employed sophisticated technology alongside the information the custodians have been required to provide in order to de-anonymize the owners of Bitcoins and those they transact with. Because of its use of blockchain technology, the government can see whom the owners paid and presume what they paid for from that information and other information they’ve gathered from other sources all over the internet. Wasn’t anonymity one of the major features of Bitcoin?

Third, there are many other options available. Bitcoin was just the first to catch on. For good or bad, there exist plenty of other cryptocurrencies with a variety of features for those that want to plant their stake in the ground on something other than Bitcoin with the belief that it will surpass Bitcoin. Yes, it’s true that it’s possible to create your own cryptocurrency using the same technology that Bitcoin uses. We could easily fork their code and start our own cryptocurrency called MangoCoin, named after Charlie’s dachshund. This would be similar in nature to DogeCoin, an actual coin launched years ago that was ironically named after the internet meme of a Shiba Inu. It currently has a market cap of $276 million U.S. Dollars. There are coins that are more appropriately named and not only match what Bitcoin is able to provide but have been programmed to have features that provide much more in terms of usefulness, like Ethereum or Ripple. Hundreds of coins exist and each has its own unique “selling point” to get users to buy in.

As we briefly touched on earlier, we spent some time last year evaluating the asset class and exchange-traded trust vehicles, which would have fit within our ETF mandate. It is a market that certainly exhibits signs of technical signals, which is a positive feature, but the giant premium to NAV embedded in the trusts presented an obvious problem for our approach.

The biggest issue for us, and one that we continue to grapple with, is how to appropriately “value” Bitcoin or any other major cryptocurrency. Before the crypto enthusiasts hit us with the “but how do you value any currency?” argument, let us be clear about one important factor; we aren’t necessarily confused about how to arrive at a target valuation for a particular coin (we are), but instead question why a given coin should have more or less value than another coin. We’ve seen plenty of arguments, but none especially compelling.

A recent piece on Investopedia entitled “Why do Bitcoins have value?” lays out several assumptions, the first of which reads: “Our first assumption is that Bitcoin will derive its value both from its use as a medium of exchange and as a store of value…if Bitcoin does not achieve success as a medium of exchange, it will have no practical utility and thus no intrinsic value and won't be appealing as a store of value.” Think about that for a second. Being a medium of exchange is what gives it its value. It’s a bit circular –for it to have value, one must be able to pay people with it, but for people to accept it as payment, it must first have value. And it isn’t important that there is actual inherent value, like there is with gold (industrial applications) or fiat currency (pay your taxes). The creators of each cryptocurrency are bootstrapping them by getting people to speculate on their future value via ICO.'

The tax-driven view of money states that what gives currencies around the world their value (or lack thereof) is each government’s ability to tax its people. Governments start their own currency because they themselves need the ability to transact – to direct economic activity. But there’s no single actor requiring payment in Bitcoin or any other digital currency. Bitcoin is not a tool to be used in the economy. Which means that the first large authority to do so with a digital currency just might dictate which digital currency wins the battle. Perhaps one that, instead of anonymity, strips that anonymity from everyone so the purchaser’s identity can be proven. That sounds like something a government would do. Until then, we may see Bitcoin hold onto top position or we may see a different, more agile and capable one, move to the front.

And Bitcoin is probably one of the worst for that government job. Since Satoshi Nakamoto limited the overall supply to a constant number of Bitcoins, 21 million of them to be exact, it would be hard for a government that adopted Bitcoin to expand the money supply to finance its debts or create economic prosperity – a useful feature of fiat currency. At a high level, inflation is a goal of the government – it sets a target inflation rate. Currently it is 2% per year. This allows the government to issue treasury debt that devalues over time. Thus, when the government sells $1 trillion in 10 year notes at 2.668% with a long-term 2% inflation rate, they end up repaying only $1.06 trillion in today’s dollars in total at the end of the ten years rather than the $1.26 trillion they otherwise would without inflation. Without the ability to inflate a cryptocurrency, where does this leave a government’s ability to borrow and repay?

Besides all that, there is governmental risk in owning and controlling a digital currency. Cryptocurrencies still rely on miners to confirm transactions. It would become a national security risk. If the United States went all crypto and did away with cash with a coin that somehow solved the above problem, a foreign power or powers could utilize the 51% attack and reverse transactions and double-spend coins or even worse, hold up all transactions, causing all sorts of chaos. If Russia and China joined up together, they’d put us down with ease. Can you imagine the propaganda? “Mine GovernmentCoin – For Your Country!” And since you must use your own electricity source for this, you’d literally be paying money to support the system of government payment. Maybe there should be tax credits for that.

These are just theories and in the world of free and open-source software where individual freedom, and anonymity are held in high regard combined with the fumbling bureaucracy that oftentimes is the federal government, we wouldn’t expect to see a government-sponsored digital coin show up anytime soon. And if we do see that at any time, we should certainly be asking who in the administration owns the first coins. Nor do we expect to see the kind of currency speculation we’re seeing today ending anytime soon – at least not until either a government does step in and say “we accept as payment for your taxes our fiat currency as well as this digital currency,” or people wise up to the fact that one coin is only good as long as there’s a large group that continues to believe it’s the best coin (which can change as quickly as new software code is written) and votes with their money.

Because of these views, we wouldn’t speculate here with our own money, much less client money. There will always be a core cabal of individuals or groups that hold any given cryptocurrency, which will inherently give it value, but why bother? If you put 5 coins in a digital wallet and forget about them, you won’t have anything other than those coins years later (if your hard drive doesn’t crash). Raw price appreciation. It’s anybody’s guess if the coin’s value kept up with inflation. If I put money in a stock, I’ll know that the company is at least generating revenue and (should I choose wisely) profits which I’ll have a claim on. Perhaps the company grows over time and the stock shows price appreciation as well. This is how value is created; not through popularizing an item so much that its own scarcity leads to an increase in value. Because at the end of the day, what’s the difference between a Bitcoin and a Beanie Baby?

After all, Beanie Babies had value too. Keep in mind this was in the late 90’s/early 2000s: Ty published a Collector’s Value Guide on a regular basis that contained reference market values for each Beanie Baby they had created. Kind of like Beckett for trading cards. It was a real market! One Amazon reviewer commented on a Collector’s Value Guide on July 4, 1999 that “I purchased this book to keep track of all of my investments, and it has done just that. It is a great book that gives you everything that a beanie babie (sic) collector needs to know. But on the downside, it has left out some of the prices for some strange reason. That's why it is only 4 *'s.” People saw Beanie Babies quite literally as investments. On at least one occasion, divorcees were ordered to split their “portfolios” of Beanie Babies under supervision in open court.

And here’s another Amazon review from May 31, 2002 for the Winter 2002 (published November 2001) Beanie Babies Collector’s Value Guide: “I was so upset when I recieved (sic) the book in the mail. Unless the book is wrong, beanie babies are going out of style. The bears (sic) prices have dropped anywhere between 10$ and 60$. It (sic) starting to scare me, I'm wondering if I made a bad investment!?” If you asked one of those individuals that invested their life’s savings in Bitcoin, they’d certainly say that history does repeat itself after all, complete with “theft, fraud, and fakery.” These days, Charlie’s wife uses Beanie Babies at school for bean bag tosses with the children. At least there’s some residual value. What can you do with a digital coin gone defunct?

That’s not to say that the technology currently has no value at all and is completely speculative. In fact, our view is that the blockchain technology that underpins cryptocurrency has disruptive potential in many areas including healthcare, real estate, and finance. The decentralized system that is the main feature of blockchain allows the system to record transactions in a secure, open ledger and in many cases cuts out unnecessary time and middlemen. Ripple (XRP) is already being used as a processing mechanism for international bank remittances. We’ve seen compelling cases for a blockchain-based system to ultimately replace stock exchanges, real estate titles, and health care records.

Ultimately, we think that the best opportunities to make money in the space are probably not in speculating on the value of the coins themselves, but instead through equity investments in transformational growth companies with a strong business case using blockchain technology. We of course aren’t recommending any specific investment and acknowledge the vehicles to access these investments may be out of reach for many investors. In most cases, these companies are private, which means that a specialty private equity fund is probably the most accessible vehicle for most investors. There is much risk here, so we would implore any interested investor to do his or her own homework and seek appropriate counsel. Still, with blockchain-based business still in the early innings, we believe the sector deserves a thorough look.

Thank you to everyone for your feedback. Please feel free to reach out at any time with questions or comments.

Sincerely,

Arthur Grizzle & Charles Culver
Managing Partners
Martello Investments

October 2018 - Rage Against the Machines

It’s typically a bad word in finance. “We want more return, and less volatility,” exclaims another firm’s imaginary client. After all, who likes uncertainty, the most basic definition of the word. Volatility has become synonymous with stress, so much so that when a pundit uses the phrase “we’re seeing a rise in volatility” on TV, one understands his or her portfolio probably just lost some money. But there’s another meaning of the word “volatility” once you move past the mundane version. Volatility is itself an asset class — you can trade it, you can hedge with it, and you can profit from it. Once the word volatility becomes a tool you can use, you look at it a different way. Some tools are misused, like we all saw in February when the XIV was delisted and many investors lost a lot of money. Most that bought the XIV did not understand what it was doing and certainly did not read the prospectus, treating it like it was any other equity security rather than a trading instrument meant to give average investors short exposure to the VIX futures market, a potentially dangerous thing. XIV took a lot of blame for exposing the volatility market to individuals that did not understand it, and we heard a good deal about algorithmic investment strategies that caused the problems that occurred that day.

After the market recovered from the February blowup and rebounded to new all-time highs, volatility reemerged in late September. Increasing interest rates and continued fears of a trade war spooked investors, leading to another moderate pullback for stocks. Mild corrections like this are a normal part of healthy markets. So far, this drawdown has been relatively mundane with the S&P 500 peak-to-trough currently less than 6%. Despite this, the selloff caused another flurry of finger-pointing from television pundits, many finding that “programmatic trading” or “the computers” were reasons for the market’s decline. The question of whether computer-based algorithmic trading can actually cause a market decline is complicated, and the debate has raged on since the “portfolio insurance” debacle contributed to the Black Monday crash in October 1987. Portfolio insurance is among the most basic hedging algorithms (when the S&P goes down, sell futures), which is a fine strategy for one person to utilize, but when it becomes so popular that it itself impacts the market, it added fuel to an ordinary selloff to cause a true panic event.

Algorithmic-trading is a buzzword, but behind it is the simple reality that computer programs are constructed by humans, and a program does what it is told by its programmer. Because of that, algorithms are often filled with the same biases and logical traps that cause humans to struggle as investors. Importantly, these strategies are implemented by people that understandably lack the foresight to see that such a strategy could itself affect the market as it becomes widely popular, like portfolio insurance in the 1980s and short-vol strategies today. This mantra was repeated ad nauseam in February 2018, when risk parity shops were outright blamed by some for de-risking during a volatility event and extending a market rout past where it should have stopped.

It is difficult to determine which cohort of trading strategies counts as the type of “programmatic trading” as pointed out by many pundits over the last few weeks. The introduction of computer-driven trading has exploded in popularity over the last two decades, and ranges from simple algorithm-based investment models to highly complicated, auto-adaptive black-box machine learning techniques. Even fundamental equity strategies, where managers screen a universe of stocks for certain qualities (value, growth, etc.) and buy a basket of the most desirable stocks, could be considered computerized trading in today's world.

Our point is that, in most cases, these programs do not in and of themselves cause a market to fall. But, they can certainly impact the violence and severity of the decline depending on the situation. It’s the point that major market moves arrive not simply from algorithmic trading, but from a concentration of lots of money employing the same algorithmic trade. This is no different than if humans did the same; it’s just that computers, in their attempt to be fast and quick to act, may all, at the same time, find the same information material to their investment strategy and may be programmed to take the same action as each other within a much smaller window of time than humans would. Remember, humans used to make decisions based on meeting with members of their firm, contemplating the decision over a period of time, and then finally instructing an institution to execute their decision. All of this expands the trading window from one day to potentially many weeks. This is long enough that many could be doing the exact same thing but as a group would not have a material effect on the market because there would always be someone willing to step in to take the other side of the trade.

Granted, there are strategies that have second-order effects. This is an intuitive idea: some algorithmic trading programs adjust to changing market environments, and therefore could begin selling AFTER a market begins to show signs of deteriorating, further extending losses. Like the 1987 example above. Or any strategy that attempts to target a certain overall portfolio volatility (e.g. Risk Parity) and responds to increasing realized volatility in markets by reducing its positions. This, when combined with the explosion in popularity of those firms that target volatility, could certainly drive the market lower with greater speed than ever before.

One eerily similar characteristic of the recent market pullbacks in February and October 2018 is the positioning of the CTA-complex ahead of the downturn. As a brief recap, a CTA (Commodity Trading Advisor) is a type of hedge fund that trades futures contracts instead of stocks, bonds, ETFs, etc. Trend-following/Momentum is a primary type of strategy employed by CTAs, and one that has grown in popularity over the last two decades; indeed, CTAs delivered incredible outperformance during the Great Financial Crisis of 2007-2009, primarily by being long bonds and short stocks. Société Générale (SocGen) publishes a collection of indices related to CTAs as well as their “Trend Indicator Daily Report” (https://cib.societegenerale.com/fileadmin/indices_feeds/ti_screen/index.html) which is the bank’s Trend-Following CTA replicator at a 15% target volatility. This daily report can give market-watchers a decent sense of how the CTA complex, particularly the trend-focused segment, is positioned at any given time. In October, SocGen’s indicator report showed long positions in stocks, oil, and the U.S. dollar, while carrying short positions in bonds and gold. This is a very similar positioning to the period ahead of the February selloff, and one that is certainly understandable at some level — stock markets have steadily advanced while interest rates have risen, and these funds are structured to bet on a continuation of the trends. The issue for market structure comes, as mentioned earlier, when these strategies respond to increasing volatility by reducing exposure, potentially leading to further volatility. The synchronized reversal of nearly all on-trend positions mentioned above (long stocks, short bonds, long oil, short gold), certainly supports this idea of general deleveraging.

Strategies utilizing artificial intelligence and machine learning have also become increasingly popular over the last several years. In a nutshell, AI-based strategies use available historical data to train an algorithm, and not only process new data as it becomes available but also re-train the algorithms in an attempt to tease out new patterns in the data and build a model that’s used to make investment decisions. The program goes through millions or billions of iterations, looking for the optimal combination of factors to profit in the current market environment. Let’s be clear about one thing, many of these strategies have had tremendous success over time. We know several of the major players in the space, and there is a lot of genius behind the idea. Unlike your basic factor-based equity strategy that focuses on value stocks, every strategy in this space is significantly different, and necessarily so: the results are entirely dependent on which inputs are chosen, the cleanliness of those inputs, what metrics they use as measurements of success when training the strategy, which brand of off-the-shelf or custom software is used, which algorithms they decide to use to refine their results, and believe it or not, which random numbers the computer pops out at any given moment during training. It is impossible to truly know how these strategies contribute to market structure or how they might respond to a shifting market regime. Even many portfolio managers inside AI investment managers struggle to fully understand why the algorithms they use do what they do. This is of course the reason AI exists in the first place: to use the power of advanced computing to make sense of data that humans simply could not do on their own.

AI strategies are only as good as the data you give them. That’s why the good practitioners are religiously cleaning their input data. And the cleaning doesn’t end there. It takes a great team of people to bring in clean inputs in a timely enough manner that the strategy can process the data and act on the new information quickly. But most pay attention to the recent data and its cleanliness. The dirty secret is that for AI to work in all environments, it must be fed data from all environments – and that fully complete dataset simply doesn’t exist. AI’s use in investment markets has exploded over the last few years at a time of relative calm, an interventionist Fed, and reasonably stable correlations. The best, most complete, and cleanest data comes from the same time period. Rates have been falling for longer than firms have complete, clean datasets. As you get further back in time, you see data quality degrade, get less frequent due to lower volume or to a lower recording frequency, and you see entire markets fall off and disappear because nobody thought the data would be useful enough to save. Sure enough, there’s an entire industry making huge profits selling old data to just these types of investment firms. In such an environment, you can imagine that these strategies have learned on their own that buying a pullback in the market is a highly profitable strategy, as the S&P has bounced off its 200-day moving average multiple times in the last year without breaking through in any significant way (the outcome of the current selloff obviously remains to be seen). And, like many of the other alternative strategy types, most AI strategies use significant leverage. The very nature of these models relies on market patterns and correlation assumptions to hold to what they’ve been fed. A potential problem arises, of course, when market conditions change rapidly in an unexpected way due to a regime shift, exogenous shock, or any other factor on which it remains untrained.

Source: Yahoo! Finance

Remember, we do not believe these types of strategies cause markets to decline; markets have of course experienced selloffs regularly for hundreds of years before the invention of the computer. Human traders and computer-driven approaches alike are likely to respond to negative stimuli with selling. We do, however, see the increasing popularity of these approaches as potentially speeding up the pace of market pullbacks. Put another way, we believe that the increasing concentration of highly reactive, high frequency strategies increases the overall fragility of markets, and the signs are all around us. It’s no surprise that 5 of the largest one-day VIX spikes of all-time have occurred in the last 2+ years, during a period otherwise characterized by a lack of volatility. We also showed some examples of shocks in the fixed income market back in our May 2018 piece.

Despite the recent pullback, larger macroeconomic indicators don’t seem to be pricing trouble on the horizon. High yield credit spreads have been particularly resilient. This means that market participants still view economic conditions as bullish and that the recent selloff is a temporary phenomenon and not likely to cascade into an extreme scenario. We have not yet seen an inversion of the yield curve, which if inverted would indicate that a recession is statistically very likely to hit. Still, the hidden risks to market structure caused by the prevalence of these approaches should cause investors to consider how they structure portfolios. It calls for diversifying your exposure not only to various asset classes but also to different strategies that behave differently as market regimes change – algorithmic or not.

We’re thankful for your continued interest. As always, please reach out any time with your questions and feedback. Our team spent the last week in New Orleans for a conference with the International Foundation of Employee Benefit Plans. It was great to catch up with some old friends and make many new ones. We have trips planned to Asheville, NC, Northeast Georgia, New York, DC, and Baltimore over the next several weeks before settling in for the holidays. If any of you are interested in getting together while we’re in town, please drop us a line!

Sincerely,

Arthur Grizzle & Charles Culver
Managing Partners
Martello Investments

August 2018 Investment Outlook – Bracing For Florence

We are a little late with our monthly piece this time. As most of you know, weather forecasters last week indicated that Hurricane Florence would pass right over us on its way inland. To be sure, a direct hit of the Category 4 storm on this area would bring catastrophic flooding and significant property damage. We spent several days last week reviewing Martello’s disaster recovery procedures, making sure we had backup plans in case we couldn’t make it to the office to trade, and buying cans of sardines. As fate would have it, a high-pressure system caused Florence to weaken materially and its path to shift southward, sparing our area from a direct hit but causing damage, flooding, and unfortunately loss of life in the Carolinas instead. Our hearts go out to those affected by this massive storm and we encourage everyone to find ways to help those affected by the devastating flooding.

One of the staggering things about any severe storm, but particularly a hurricane, is the extent to which the approaching event puts on display the fragility of our modern lives. Think about the convenience that we have been able to engineer as a society. Think about the convenience of the world’s historically most precious commodity, potable water, and how you can just purchase it in a small handheld bottle for just over a dollar at the corner store. But within 24 hours of the first report that Florence would impact our area, most stores had entirely sold out of regularly priced water. Sure, you could make it through Florence on Evian or Perrier if needed, because “premium water” was still available, but water that most people would typically buy was not. This is a pattern I observed nearly every year as a kid growing up in South Florida and have continued to observe with hurricanes here in Hampton Roads.

There seem to be technological and psychological factors that are converging to arrive at this “run” on water – and other products as well – every time a rough weather pattern nears. Modern-day supply chains have evolved into a just-in-time model where the supply chain reacts almost immediately to consumer demand and pushes product out to the store when it is needed. This helps the store avoid stocking too much of any product for too long. These efficient systems have undoubtedly been built with the ability to predict future demand based on historical demand (say, chocolate deliveries increase around Valentine’s Day before the stores come close to selling out). But currently, the lag is a bit too long and the demand too high when it comes to restocking emergency staples. There’s never enough bread or milk in a snowstorm. On the psychological side, this is an excellent example of a “short-volatility” mindset in practice. The system is built for, and consumers are accustomed to, the continuation of normalcy. As I mentioned, clean drinking water is probably the most precious commodity in the world. Yet, our society depends on and expects its limitless and (nearly) free availability at the turn of a tap. The prospect of a major hurricane, surely a volatility event in weather terms, puts these dependencies to the test, causing people to stampede for the few remaining bottles as they wrestle with the reality that no system can engineer away the unexpected.

I’m not a prepper by any stretch, but even I know that it would be incredibly easy for most people to insure themselves against a prolonged period without water. Based on the results of a simple web search, a single person could avoid this scenario with a mere $10 investment, which would buy them about 6 gallons and 6 days of water. For a family of four, the cost is even less per person since you can get a better price for buying in bulk. Why then, do so few people choose to insulate themselves from this possibility? It’s near chaos in the water aisle as the weather approaches. It’s not for lack of warning. These events happen once or twice every year, and it’s the same thing each time. Sure, it would be easy to point to the money required or the wasted space in the cabinet/garage, but the simpler answer is that most people don’t worry about it until the storm is on the way. They’re used to the engineered conveniences of modern life. This is what I meant by the “short-volatility” mindset. By not preparing for such an event ahead of time, the water-bottle-less are betting that an event will not happen, or that even if it does they will be fast enough to the store to guarantee their supply.

-A.G.

We have discussed short-volatility often and in many forms, from the explicit (inverse vol products and strategies) to the implicit (correlation assumptions). To be fair, the short-volatility mindset is proven right most of the time—most days, the hurricane won’t come, there will be enough water, the market won’t blow up, and stable correlation assumptions will hold. It is the unforeseen catastrophe, though, that challenges these assumptions, be it a hurricane or a market shock. Charlie and his wife have an infant son and when they heard the hurricane was coming, they found a hotel with a backup generator and a concrete structure and paid up for it. It went unused after all, but this physical insurance policy was necessary for their peace of mind. This characteristic of shocks being unexpected, rare, and calamitous leaves managers in constant search for the most cost-effective and efficient hedge. In markets, hedges are typically very costly and inefficient. For example, the cost associated with rolling protective put options to protect an equity portfolio is typically prohibitive, as it eats up most of the expected return of a stock portfolio.

Still, for most investors, some form of protection is required in attempt to combat negative outcomes. The thought of a storm-induced water supply emergency highlights one kind of systemic fragility. Luckily, ten bucks and some wasted pantry space is a very cheap hedge. In markets, though, it is pretty much impossible to time the next shock or know where it will come from, but a good guess would be the debt market. By nearly every metric (Business Debt/GDP, Federal Debt/GDP, Margin Debt/Disposable Income), the US is more indebted than at any other time in history, as is a solid chunk of the developed economies globally. A few months ago, we highlighted statistics showing the increased leverage in the investment grade corporate bond market and discussed the potential systemic shock of a widespread ratings migration in the next recession. In addition, credit spreads remain historically tight in high yield fixed income and covenant-lite leverage loan issuance continues to boom, both of which reflect investor optimism about even the least creditworthy borrowers despite record indebtedness across the economic spectrum.

With a potential storm brewing and many forms of hedges prohibitively expensive, many investors are left in a bind about how to best protect their portfolio from potentially large losses in the next downturn. Though it’s pretty much impossible to time the turn of a cycle, we can use disciplined processes to assess opportunities and risks. We’ve highlighted the benefits of this approach in many past posts; suffice it to say we believe that vigilance is more critical now than ever. We know that, despite bullish trends and some positive economic releases, clouds are forming around valuations and debt. As stated above, we are all wired to assume a continuation of normalcy. It’s important to keep at front of mind, though, that valuations are stretched to levels historically only associated with some of the worst crises in US history. At the same time, the system is more levered now than ever. Additional leverage means additional risk, period. This dangerous combination of factors calls for focusing on the risks embedded in a portfolio and looking to reduce exposures at the first sign of trouble. When the forecast calls for clear skies ahead, and it certainly will at some point, we can shift our focus to capitalize on the many opportunities that will surely be available.

We appreciate your time and interest. Please feel free to reach out with questions or feedback, we would certainly enjoy hearing from you. As always, we wish you great health, many successes, and the wisdom to throw a few gallons in the garage for safe keeping!

Sincerely,

Arthur Grizzle & Charles Culver
Managing Partners
Martello Investments